
The following is from an email exchange which will remain anonymous. But rationalists will find it quite interesting, hilarious, and extremely saddening…
“Dear Joseph,
I sent the link to your Youtube presentation titled “There is no radiative Greenhouse Effect” to [anon1] (who’s just started a PhD in statistical Mathematics – so tends to think he knows it all), who did respond, but not favourably. In summary, [anon1] followed the presentation to the point (at 1m 30s) where you invited the listener to perform a Google search i.e. “derivation+of+radiative+greenhouse+effect+diagram” which he immediately did – and his Google search returned many results showing a curved Earth model (30 curved or spherical: 6 flat). At this point, his desire to proceed further into the presentation totally evaporated – your argument had been destroyed.
We have since discussed the topic on several occasions and each time he rejects the argument that there is no radiative Greenhouse Gas effect for the following reasons;
- I (me personally) am desperately grasping for any opportunity to substantiate ‘my belief’ that a colder object cannot transfer heat to a hotter object (as required by the back-radiation theory of GHG). Belief is contrary to the scientific method – one should only believe in where the science takes you and that is that CO2 is a Greenhouse Gas. For the GHG theory to get this far then there can be no reasonable dispute, no doubt. The atmospheric GH effect been proven and accepted by all main-stream scientists – why would they lie? How could they be deceived? Just because, for example, one can’t envision that, in quantum physics, a particle can be in two places simultaneously doesn’t mean that quantum mechanics has been falsified. Something which is beyond my own comprehension is no less true.
- The author’s (your) claims are so extravagant that, if they were indeed true, ALL well-respected journals would be honoured to be chosen to publish your work, the Impact Factor would be very high.
- If your work has been rejected for publication, then it can only be because;
- The topic of your articles were not considered a good match for the particular journal,
- Impact factor for the articles were too low for the journal,
- The journal’s own reviewers rejected the robustness of the scientific method use,,
- You could not comply with the journal reviewers’ requirements for the improvements deemed necessary for publication,
- Your “H” Factor (?) is not sufficiently high (and questions whether you actually have one)
As you may have rightly imagined, [anon1] thinks that I am deluded on this matter (both the science and politics) but for my part, I can’t overcome my ‘meaningless hopes’ that CAGW is a massive fraud that will, eventually, be exposed. Perhaps the recent article (highlighted by PSI) by Kramm et al 2017, in Natural Science, might create more possibilities for other main stream Journals to consider publishing more articles that convey a similar conclusion?”
My reply:
“Hi [anon2],
For a mathematician, [anon1] has a low degree of numeric comprehension. For it is the numbers in the radiative greenhouse effect derivation which I show in the presentation which are from a flat Earth and which do come from multiple university and “official” sources. It’s the numbers!
I did the Google search and find a bunch of grade-school level diagrams showing backradiation heating the planet (using spherical cartoon diagrams of Earth): This idea comes from the flat Earth models which dilute solar input over the entire planet at once. It’s the mathematics that matters and where the original mathematics came from. I note that none that I can see from the search of the cartoon spherical models actually show the derivation of the RGHE mechanism. What they show are only the final numbers where it has been assumed that the previous derivation of the mechanism is correct and where the atmosphere provides twice the heat of the Sun. Does he really think that the atmosphere provides twice the heat of the Sun? You need to search for the right thing – the search specified doesn’t seem to actually return the derivation. This is rather ham-fisted of him…just because a search returns something doesn’t mean that it is the correct thing. One needs to then sift through the results for what is actually desired; [anon1] doesn’t actually seem to know what is desired, although he is acutely aware of the conclusion he desires!
People are braindead. They are just braindead. They have no comprehension of anything whatsoever. And they don’t understand where anything came from or why things are the way that they are.
For the points:
1: This faith in science is the undoing of science. The Copenhagen Interpretation of quantum mechanics is a convention! Does he know what that means? It means that there are some several dozen different ways to interpret quantum mechanics ranging from ones which are completely deterministic to completely randomist. The randomist Copenhagen interpretation is a convention only. It’s arbitrary. It was chosen so that mathematical “hidden-variables” wouldn’t exist because they didn’t know how they would measure them. They didn’t know how to measure “i” for example. This is an arbitrary empiricist preference that in no way dictates whether the hidden-variable determinist interpretations are incorrect or whether the hidden-variables may in fact one day be measurable. In other words: IT IS A BELIEF! So much for belief not being part of science! Is [anon1] aware of the pilot-wave interpretation for QM? It was never refuted…the Copenhagen Convention simply arbitrarily decided that everyone should stop researching it. As for the science, thermodynamics does indeed restrict that heat only flows from hot to cold, and that once heat input is used to warm an object, that same energy can not be used to heat same object some more. I am sorry but [anon1] is painfully uninformed in mathematics, physics, and science and science history in general. There is no “proof” of the RGHE anywhere. There is only an assumption of it derived out of flat Earth physics.
2: Not when political correctness and political motives exists. Not when people have been made to be afraid of voicing different ideas and criticisms. Does [anon1] live under a rock!? Is he that unawares of the existence of political pressure, peer-pressure, narrative, etc.?
3: It hasn’t been rejected, it is being held without movement on review. And as for my day-job, I have publications in the most highly respected astrophysics journals in the world – the highest possible rated ones. I have a new publication soon to come out in PASP (Publications of the Astronomical Society of the Pacific), for example. Does he understand that where I have published doesn’t affect the Laws of Thermodynamics? (If he were to ever familiarize himself with them.)
I am sorry but seeing this coming from [anon1] saddens me greatly. Not about him or you in particular, but just because in general it shows how easily captured people’s minds are and how extremely difficult actual critical thought is for most people. As for [anon1], being 26, I am simply reminded of the quote (attributed to various sources):
“If you are not a liberal at 25, you have no heart. If you are not a conservative at 35 you have no brain.”
As it is, critical thinking only or at least preferentially develops in the conservative. Many still never make the switch at all.”
Flat Earth Physics
Flat earth physics is identified by the numbers, by the physics, by the mechanism it purports to explain. The derivation of the radiative greenhouse effect of climate science comes from flat Earth accounting of energy and heat from the Sun where sunshine is spread over the entire surface area of the Earth at once as if the Earth is a flat plane. That’s where the RGHE comes from and official references to this fact have been provided.
If people then use the result of that and place it on a spherical depiction of the Earth, it does not change the fact that it is all flat Earth physics, and hence pseudoscience.

What Is Flat-Earth Physics
ANSWER: It’s using math derived from a disc to label a sphere, and then forgetting what has been done.
It’s kidding yourself that a disc is an average of a sphere … OR … knowing the difference but fooling others into believing that there is no difference.
“The atmospheric GH effect been proven and accepted by all main-stream scientists – why would they lie? How could they be deceived?”
They use this argument because is actually works on most people. In reality though it is combination of three logical fallacies plus an appeal to morality.
The logical fallacies are:
1) The “no true scotsman” fallacy. If you do not accept that the GH effect to be true than you are not a “main-stream” scientist and can therefore simply be dismissed.
2) The “argumentum ad populaum” fallacy, which is the proposition that since most people believe the GH effect to be true than it must be true.
3) The “appeal to authority” fallacy. It is asserted that the assertions of “scientists” are somehow authoritative. Therefore if a scientist says the GE is true, then it must be so.
The appeal to morality argument suggest that if you say that the GH effect is false then you are accusing the scientists that believe in it to be lying. It is inconceivable to the author all of them could be lying, therefore what they are saying must be true. He, of course, has forgotten about the pseudoscience called the geocentric or Ptolemaic model of the Solar System that was challenged in the 17th century by Galileo who advanced the heliocentric model of the Solar System and for doing so he was persecuted by the Catholic Inquisition, the pseudoscience called “spontaneous generation” was challenged by Louis Pasteur in the 19th century who demonstrated the existence of microorganisms, the pseudoscience called “luminiferous aether” was tested experimentally in 1887 by Michelson and Morley and today nearly no scientist believes in it, the pseudoscience that ulcers were caused by stress was challenged in the 1980’s by Barry Marshal who proved instead that ulcers are caused by the bacteria H. pylori, the pseudoscience called “phlogiston” was challenged in the 18th century by scientific experimentation that proved that fire was not a material element, the pseudoscience called “immovable continents” was challenged in 1912 by Alfred Wegener who laid the ground for understanding plate tectonics, the pseudoscience called the “four humours” theory of human physiology was debunked in the 19th century by medical research, the pseudoscience called the “static universe” hypothesis was challenged in the 1920’s by Edwin Hubble which yielded the understanding that the universe is expanding,t he pseudoscience called the “young Earth” hypothesis that asserted that the Earth was only 20-40 million years old was debunked in the 18th century by the work of Charles Lyell and Charles Darwin.
All of these pseudosciences were at one time main-stream beliefs within the “scientific community.” Were those who once taught these pseudosciences “lying”? Where their students being “deceived”? Whatever you call it, it not only happened, it is happening again with regard to the GH effect hypothesis.
From Columbia University:

From Harvard University:
From MIT:
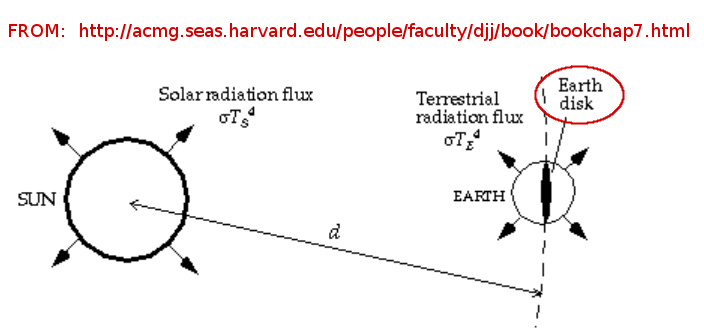
To be clear: Using the cross-section of the Earth, which is a disk, to calculate the energy intercepted by the Earth from the Sun *is correct*. It is correct geometrically, physically, and mathematically. It is also correct to use this energy, diluted by a factor of 4 for the surface area difference between a disk and a sphere, to calculate the theoretical average flux *OUTPUT* of the Earth and its theoretical blackbody temperature. This is all OK and the Earth does have said theoretical blackbody temperature.
The error which turns this into actual flat Earth physics pseudoscience comes *when the sunlight intercepted by the Earth is spread over the entire surface of the Earth at once, and is used as an INPUT*. This is the precise moment and step of the derivation where it turns into flat Earth physics and bad science, and pseudoscience. The difference being exchanging the factor of 4 diluted *terrestrial output* for the raw *solar input*. This is what effectuates the flat Earth physics, what makes sunlight too weak to heat anything above -18C, and from where the postulate that the atmosphere provides twice the heat of the Sun originates. It is where the paradox originates between a real uniformly illuminated surface at 1 astronomical unit from the Sun experiencing 1370 W/m^2 of solar radiation, vs. a fictional uniformly illuminated surface experiencing 1370/4 = 342.5 W/m^2 of flux from the Sun which *actually requires it to be 2 astronomical units* from the Sun.
It is based on these physically false and logically impossible premises (and these are classical concerns, not quantum concerns for those who wish to argue that QM shows that paradoxes can exist…not applicable here!) – i.e., input diluted by factor of 4, uniform illumination, paradox in what distance the surface is actually at – that the RGHE postulate then comes into existence. The RGHE postulate then carries along the logical and physical errors from its foundation into its claims about the cold atmosphere making the warmer surface warmer, about backradiation, about redefining how an actual greenhouse functions, etc. Because the RGHE is founded on nonphysical and illogical premises, it then finds itself violating other fields of physics such as thermodynamics most importantly.
What the clever know-it-all mathematical type (“PhD in statistical Mathematics”) forgets is that science is NOT an assemblage of known facts, science is a an incomplete number of APPROXIMATIONS for how we try to rationalize the universe we observe and experience.
Our science can never be either complete or fully factual, as our measurement methods are not completely perfect.
Science will continue to progress in all fields because at each iteration (of describing an observation) we attempt to get closer to the truth — sometimes we are successful, other-times less so.
Climate science more than most is very incomplete and so far very approximate. Your “PhD in statistical Mathematics” person should understand this, and realize that ALL explanations for how weather and climate work are currently in flux, that no one explanation, hypothesis, or theory fully fulfils all the necessary criteria to say we understand climate even at some very basic levels.
Joe is ABSOLUTELY RIGHT !!!
There is such an abundance of overwhelming evidence that he is right people who “deny” this are either braindead or corrupt liars.
The equation used to calculate the Earth’s “temperature” at http://people.atmos.ucla.edu/liou/Lecture/Lecture_3.pdf – “for extra credit” – is
Solar constant(1 – albedo) x pi.Re^2 = sigma.Te^4 x 4 pi. Re^2
The left hand side is the heating potential over the disk during daytime – thus the heating potential of the solar radiation is ~ 1368 (Solar constant) x 0.7 (1 – albedo) = ~957 W/m2 maximum.
The right hand side is the “reaction” of the “Earth black body system”, if indeed the ludicrous notion of a “first law balance”, where the only thing input radiation can achieve is a temperature change, is in any shape or form real. I say ludicrous “first law balance” because there are many many degrees of freedom in the physics of Earth’s systems beyond a simple temperature change.
To overcome the obvious problem that the Earth’s surfaces are not some sort of superconductor instantaneously transferring energy equally over the Earth’s sphere they come up with the argument the Sun should have heated Earth as much as possible over billions of years.
Obviously the mathematics balance but Joe is absolutely right to show that what they use as insolation is really output at 1/4 of the real value.
How these people can continue to argue this nonsense if they had any modicum of intelligence is totally beyond me ! Actually, their argument is that temperature is caused by radiation “balance” rather than radiation is caused by temperature ! This is explicitly obvious in their “radiative balance equation” and all of the “thermodynamics” they quote.
Just take a typical solar panel with, typically, 1.25 square metre area, an efficiency of the order of 15.6%(I’ve quoted my panels) and a rating of 200 W (at 1000 W insolation). If the 239.7 figure routinely quoted is “real” in any substantive manner then these panels could not have an output of more than ~47 W rendering them the largest waste of money available. A 5kW system regularly advertised on TV here would require over 100 Panels versus the 25 sold.
Just how they twist the obvious insolation value – Solar constant(1 – albedo) x pi.Re^2 – into the obvious output value – sigma.Te^4 x 4 pi. Re^2 – is simply astounding !
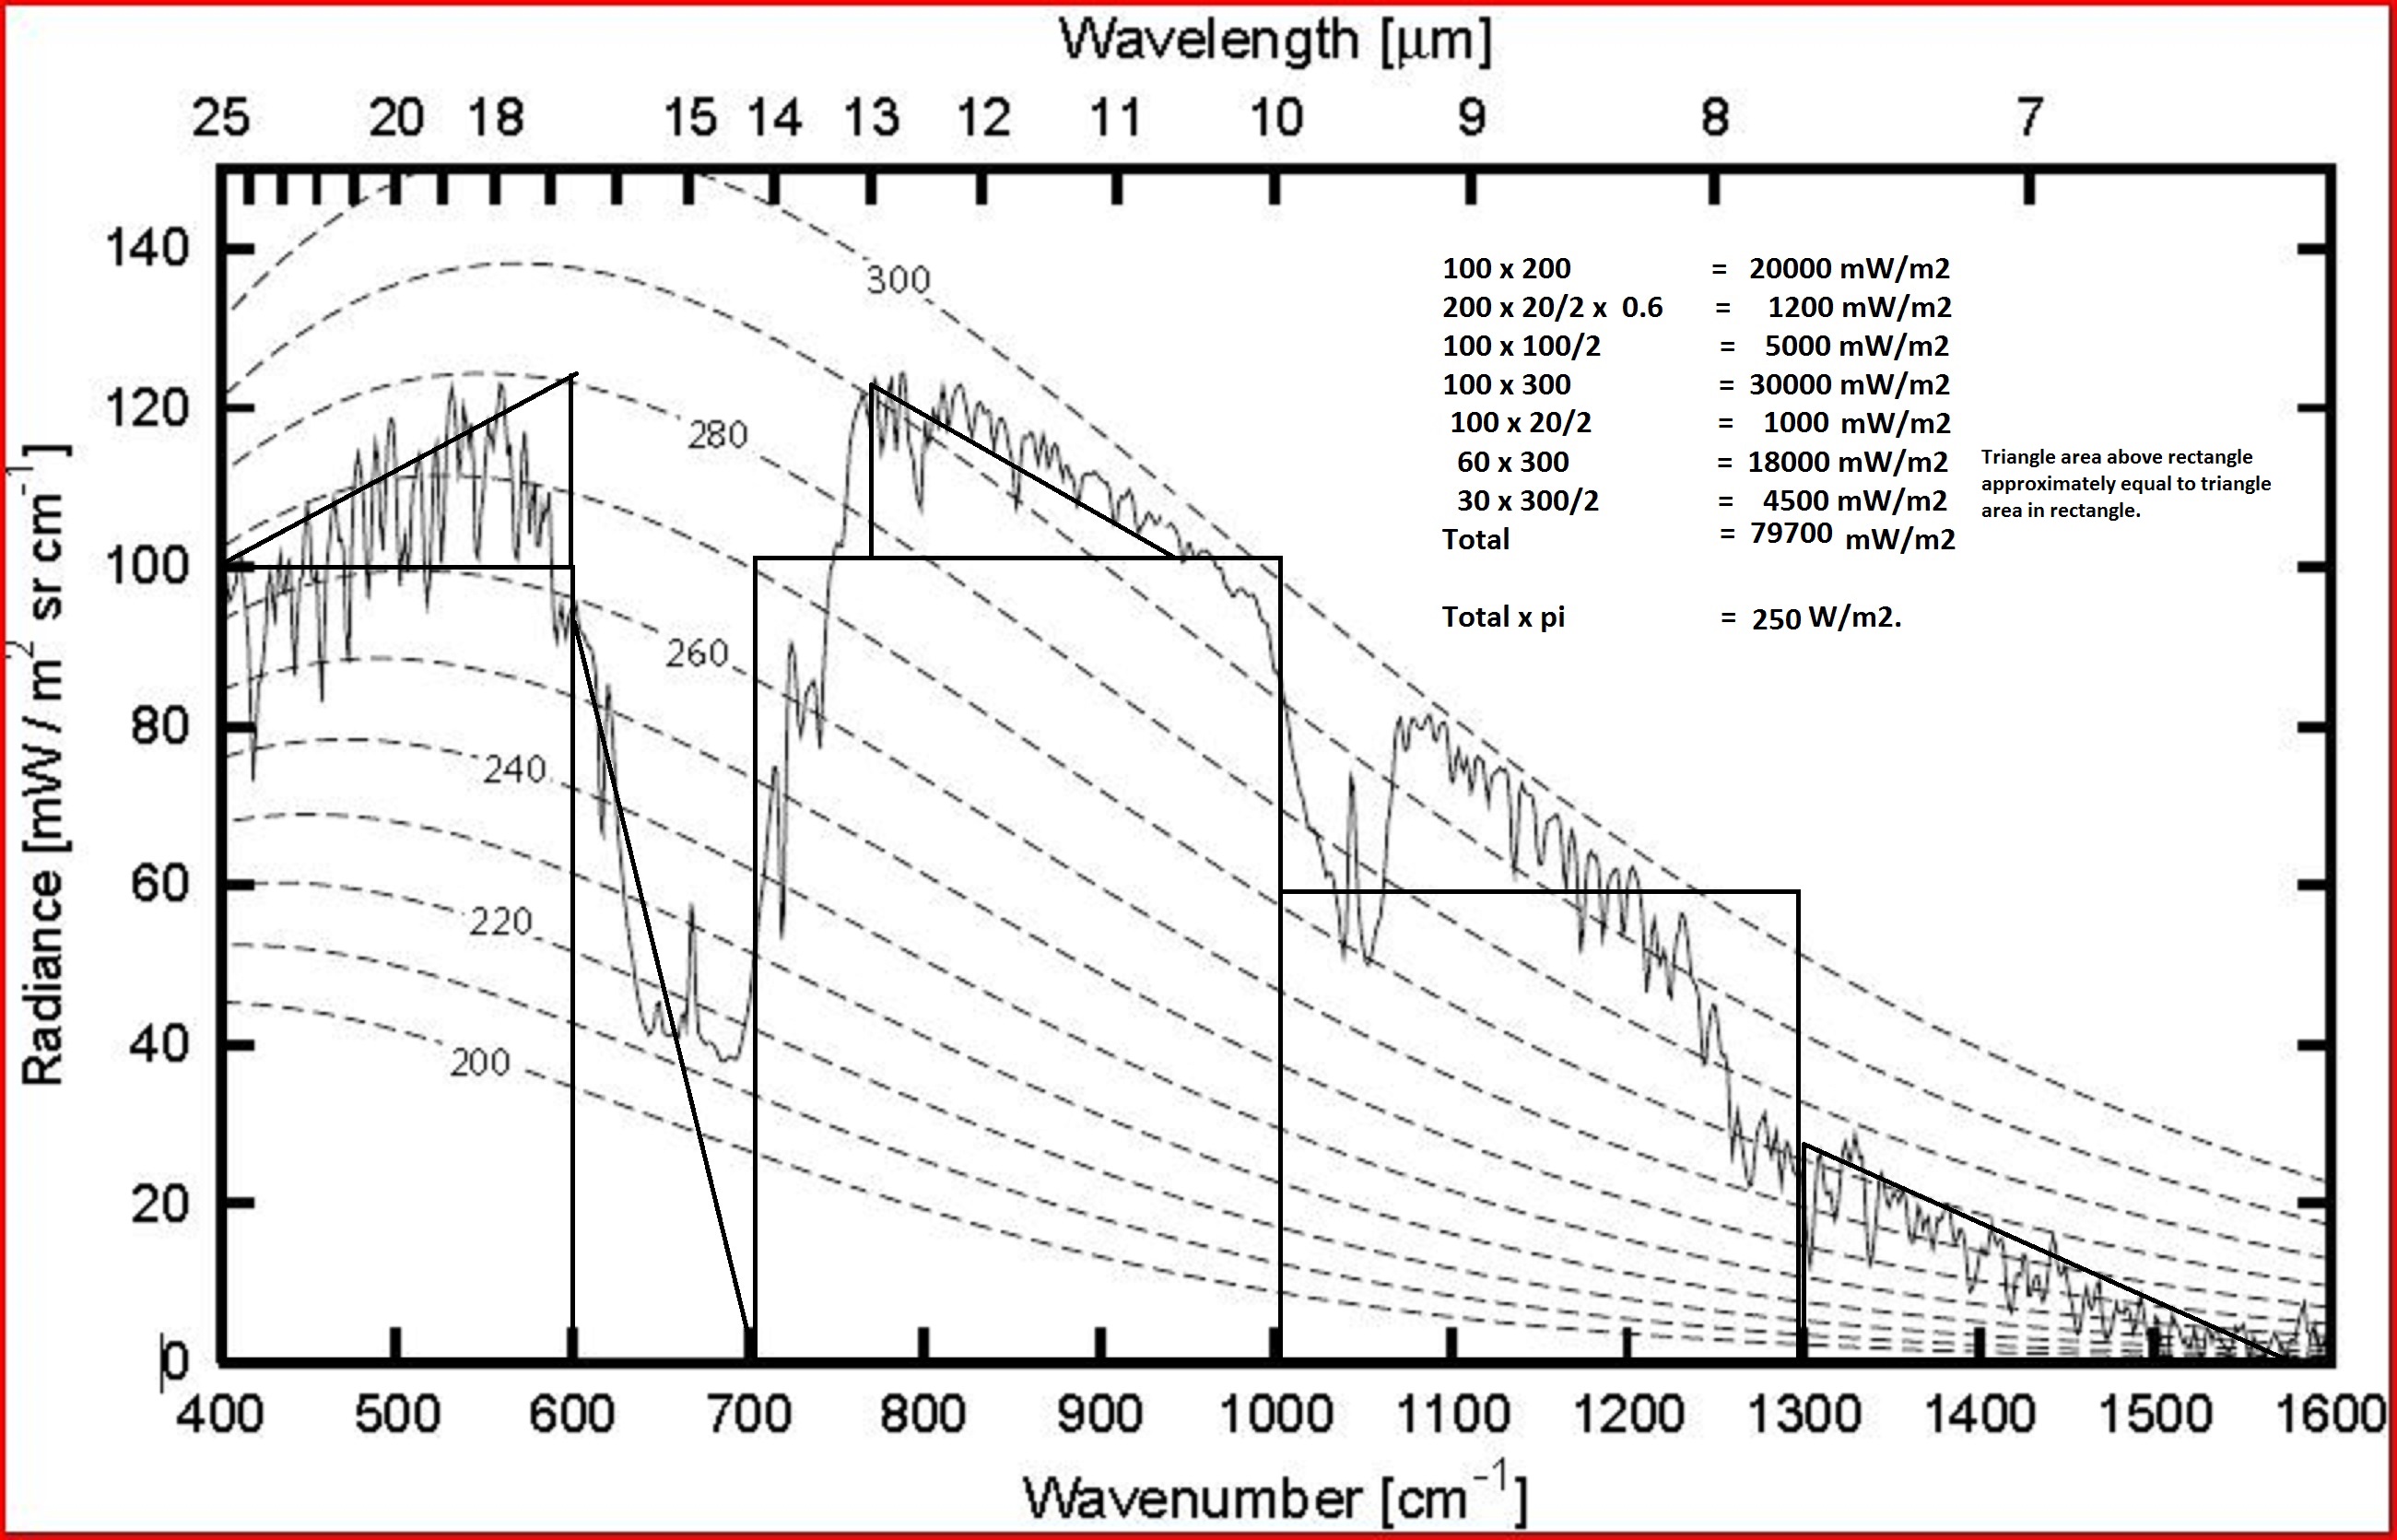
And they regularly show The Nimbus satellite image of IR as provided by Petty as evidence of “radiative trapping” at the wave numbers of CO2’s major absorption band – centred on ~667 /cm – which they state, disingenuously, coincides with Earth’s peak radiation emission spectrum.
There are 2 problems with this claim:-
1. The area under the curve approximates a total radiative value of ~250 W/m2 – higher than their calculated 239.7 W/m2 value anyway and hence not really indicative of any radiation “trapping” at all.
2. The claim that CO2 “traps” emissions coincident with peak emissions of 280 or 300 K Planck curves is only correct in the wave number plot. In a wavelength plot the peak emissions occur at values lower than 10 micron and the CO2 absorption band centred on 15 micron ( ~667 /cm) is shifted to the fringe of the plot.
Just wanted to try this:-
JP,
that clarification really helped, and so let me apply it in a display of my difficulty with it:
Actual flux of the sun = 1370 W/m^2
This is the same flux on a HALF sphere as it is on a disc whose radius is the same as the HALF sphere.
1370/2 = 685 W/m^2 is the average flux for the sunlit HALF sphere.
The next step is harder for me to see the logic, which is then dividing this HALF-sphere average by two again to come up with an average flux for the WHOLE sphere, half of which never gets any direct flux at all.
This is probably where geometry takes a backseat to thermodynamics, right? Do we, then, reason that if flux IN equals flux OUT, then the WHOLE sphere must be considered the geometrical body doing the fluxing? And since there is no other source of fluxing IN, then we can consider the WHOLE sphere as the geometrical body doing the fluxing OUT?
This seems like squeezing a lot out of the mathematical concept of an “average”. Apparently, the flat Earthers wanted to keep going with it — gave ’em an inch, and they took a mile.
Clearly, this average is a different average than the average of near-surface temperatures in ONE LAYER (onion skin) of the WHOLE sphere.
Pingback: What is Flat Earth Physics? | Principia Scientific International
Rosco,
Would you consider re-writing this paragraph:
The combination of phrases seems very convoluted to me. Maybe break it up into more separate sentences for smoother reading. As is, it seems to contain some very good wisdom jumbled up, and I can’t get through the jumble. (^_^)
And now that you successfully posted that plot pic, would you consider explaining what it is. I’d like to see YOUR explanation. Thanks.
I want to follow up on the last sentence of my previous post:
Clearly, this average is a different average than the average of near-surface temperatures in ONE LAYER (onion skin) of the WHOLE sphere.
… which raises the question, “Assuming flux is calculated for a surface, now to what surface does the average flux OUT apply?” Where is the surface for which the one-fourth solar flux OUT applies?
An average flux would seem to require an average surface from which to flux. It’s not a real surface. This surface does not exist. It has to be made up, and it cannot be the same surface for which global average near-surface temperatures are figured. So, what is the logic that enables us to make up this “average surface of average flux OUT”? And what is the logic that enables us to locate this average surface? I do not quite accept the reasoning on how we arrive at the LOCATION of this “average surface of average flux” (as I am calling it).
How are we defining the SURFACE of the Earth globe? This seems to be a further source of confusion driving the flat-Earth treatment of flux. The surface would seem NOT to include the atmosphere, … OR it would be the TOP of the atmosphere, which would seem NOT very clear, and so an agreement of where the atmosphere ends would have to be established.
So, I’m thinking that this forces yet ANOTHER average into the mix — namely, the average between the TOP of the atmosphere and the BOTTOM of the atmosphere. Following this reasoning, I would see the “average surface of average flux OUT” to be the average distance between the bottom and top of the atmosphere — is this correct? Problem is, there does not seem to be an agreement on exactly how high the atmosphere goes, and so how could there possibly be an agreement based on the DEFINITION of the top of the atmosphere?
The height of Earth’s atmosphere, thus, appears to be an arbitrary general agreement — why this agreement? I see estimates from 480km up to 1000km — that’s over double the lower estimate.
And yet the typical “average” or “effective height of emission” is often cited as 5km, which would seem to imply that the definition of top of atmosphere would be only 10km, which is forty-eight times smaller than the lowest estimate of Earth’s atmospheric thickness. I am assuming that this is because 90% of Earth’s atmosphere is in this 10km height (if I remember correctly) – yes?
But this poses all sorts of confusion to deal with:
(1) We find a pretty good average for the average solar flux onto Earth’s hemisphere by squishing a hemisphere into a disc of the same diameter.
(2) We then stretch the idea of “average” to distribute this flux for a hemisphere over the WHOLE sphere.
(3) Now we say that flux IN must equal flux OUT, but to make this statement, we use the average flux over the whole sphere.
(4) Now we have to define ANOTHER average over which this average flux OUT happens, and this involves agreeing on the height of Earth’s atmosphere, in order to get an average surface from which this average OUT flux fluxes.
To repeat: Define average solar flux for a hemisphere, … divide this in half and agree that the result of this second division means average flux for the whole sphere IN and OUT, … now agree that “Earth’s atmosphere” means “only 90% of Earth’s atmosphere within the 10km height”, … so that we might now agree that the “average surface of average flux” OUT to space is located at 5km in height above Earth’s solid/liquid “surface/near-surface”.
This seems like a lot of averaging and a lot of arbitrary agreements. But even so, assuming that everybody is okay with this, still the “average height of emission” fluxing out is 5km ABOVE the surface for which the “global average near-surface temperature” is figured. Consequently, any temperature associated with the “average height of emission” is a DIFFERENT temperature than any temperature associated with the average of near-surface temperatures around the sphere at a 10 METER height from the surface.
One average is agreed to be for a height 5 KILOmeters up. The other average is agreed to be for a height of 10 METERS up. The temperature associated with the “average surface of average flux OUT”, at 5 KILOmeters above Earth’s solid/liquid surface, is -18C. The temperature associated with the surface of flux IN, at 10 METERS, is +14C.
The -18C. is for a surface located 9,990 meters ABOVE the surface for which the +14C. is agreed to exist. I see this as the second instance of FLATTENING in the flat-Earth treatment of flux — namely, flattening 9,990 meters into 10 meters, and considering -18C. as a measure of the same domain as +14C.
The equation used to calculate the Earth’s “temperature” at http://people.atmos.ucla.edu/liou/Lecture/Lecture_3.pdf – “for extra credit” – is
https://www.dropbox.com/s/sck32egeovoz26b/Lecture%203.pdf?dl=0
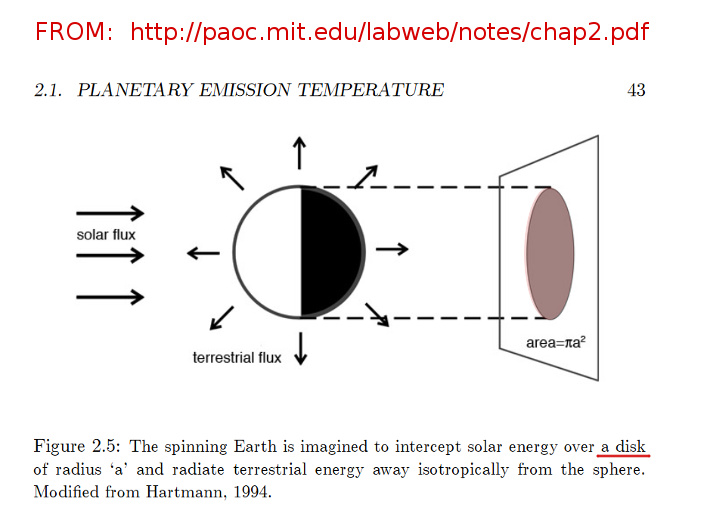
It is a simple “energy balance” statement. Refer to your diagrams of a disk and sphere.
The left hand side is clearly the solar radiation incident on the disk. Using the lecture’s value of 1372 W/m2 Solar constant the power incident on the surface of the disk would be 1372 X 0.7 ( 1 – albedo) = 960.4 W/m2. This is equivalent to the power emitted by such a blackbody disk at a temperature of ~361 K or ~87° C. We can ignore the area as it cancels out except for the factor of 4 and speak in terms of power per unit area.
The right hand side is the “energy balance” “reaction” to the incident power of the left hand side. They say a sphere of the same radius must emit 960.4/4 for “energy balance” – it absorbs 960.4 x pi.R^2 and must emit 960.4 x pi.R^2.4.
Note this value of 960.4/4 is emitted over a spherical surface area. The claim is that it MUST emit as much as it absorbs else equilibrium is not possible.
Thus we have 960.4/4 = sigma Te^4.
You can’t simply state the obvious relationship that the irradiated area of a sphere is half the total area because the incident radiation varies over the irradiated area. The incident effect is “normal” to the surface and for parallel radiation from the Sun the value of the incident radiation “normal” to the surface is the cosine value of latitude for “north to south” (pi/2 to minus pi/2) and the sine value of longitude for “east to west”. Using integration this equates to uniform irradiation over a disk of the same radius.
What I mean by “there are many many degrees of freedom in the physics of Earth’s systems beyond a simple temperature change” is really evident to any who think’s about it.
The hottest land surface temperature ever recorded is 70.7°C recorded by LandSat.
The same incident radiation that induced that temperature has never induced a temperature in Earth’s oceans above ~36°C.
Water absorbs incident radiation or other mechanisms of heat transfer and evaporates without ever reaching the theoretical temperature such energy transfers could induce in other materials.
No matter how much energy is absorbed by water under “normal” circumstances it never exceeds 100°C.
The laws of black body radiation were formulated by observing the output from the cavity oven experiments. I doubt they are applicable when other “degrees of freedom” apply such as convection in both liquids and gases. Liquids not only convect but also display changes in viscosity with temperature. Gases never exhibit the continuous spectrum associated with blackbody radiation.
Read this excellent document – http://junksciencearchive.com/Greenhouse/Earth-s_Climate_Engine.pdf
The diagram I posted is from a textbook on Atmospheric Radiation by Petty.
It is a composite of radiation measurements made by the Nimbus satellite. The sensor on the satellite records the radiance at various wave numbers and these are combined into the graph. Various Planck curves are added for various temperatures.
There is an interesting feature of Planck curves in that if you change the variable – frequency, wavelength or wavenumber – the value for “peak emission” changes.
In the graph above for wavenumber and ~300 K the peak emission corresponds to about 555 /cm or 18 micron. Plot the Planck curve for 300 K using wavelength as the “x-axis” variable and peak emission occurs at 9.66 micron or 1035 /cm.
Alarmists claim the large “bite” in the emissions recorded by the satellite between roughly 555/cm and 800/cm equates to energy “trapped” by CO2. It certainly appears that radiant emissions recorded at the TOA at these values are reduced. They claim this happens at the part of the spectrum where peak emission occurs and this is a big deal.
As I said however the “peak emission” value is only true for a wavenumber plot – a wavelength plot has emissions at these values on the fringe of the curve.
Thus no-one should claim the CO2 absorbs radiant emissions at the peak emission values because it changes with choice of variable.
If the satellite sensors are calibrated using the standard laws for black body radiance an alternate interpretation of the graph is that CO2 – ostensibly extinguishing all emissions to space at the wave numbers it absorbs close to the surface is emitting at a temperature of 220 K (Minus 53°C) while Ozone at the TOA is emitting at 270 K (Minus 3°C) ?? This is what the Planck curves assert.
My opinion is black body “laws” only apply to “black bodies” which emit continuous spectra and cease to apply at phase changes. I cannot accept they apply to gases emitting line spectra.
Rosco, can you clarify:
The hottest land surface temperature ever recorded is 70.7°C recorded by LandSat.
By “land surface” are you referring to the air at some height above the ground, or are you referring to the ground? In other words, what’s the precise definition of “surface” here that LandSat measures?
The same incident radiation that induced that temperature has never induced a temperature in Earth’s oceans above ~36°C.</i?
Similarly, by "in Earth's oceans", are you referring to the surface of the water, or air above the water at some height, or some depth of water below the surface?
Do the instruments "know" precisely what they are measuring?
This is all very interesting, given how much of Earth's surface is water.
Are people trying to meld substances in a way that is unreal, non-physical to this world? That is, are heating water, heating air, and heating, say, sand distinct heating processes? And how could you define a meaningful "average" over all of these juxtaposed on the same surface?
Does "flat-Earth physics" also contain conflation physics?
… messed up my italics tag. Crap!
JP, another good article to write:
the fallacy of shifting lapse rate profile
another lie to make their BS “work”.
Rosco, can you clarify:
The hottest land surface temperature ever recorded is 70.7°C recorded by LandSat.
LandSat records the SURFACE temperature NOT the air temperature. The record measured air temperature stands at ~57°C in the 1930’s at a ranch in Death Valley.
ALL ocean temperatures are water surface to ~2000 metres deep water temperatures NOT air temperatures – before the relatively recent introduction of more sophisticated buoys such as ARGO a lot of ocean temperature measurements were taken by recording ship intake water temperature.
Obviously ocean temperature recording numbers are tiny compared to the surface area of the oceans.
This statement from Wikipedia about satellite sensors is reasonable – “Satellite temperature measurements are inferences of the temperature of the atmosphere at various altitudes as well as sea and land surface temperatures obtained from radiometric measurements by satellites. … They measure radiances in various wavelength bands.”
Obviously the term inferences means that the laws of black body radiation and the known properties of water, gases and soils etc such as emissivity etc are used in the “inference”. The main factor in satellite measurements is coverage.
“Do the instruments “know” precisely what they are measuring?” They say they do.
Oceans do not heat to the same values as any land surface at the same level of Solar radiation because water undergoes phase changes by evaporation whilst land surfaces do not. Thus the Earth as a whole does not ever reach its potential black body temperature equivalent to the Solar insolation.
Using the reasonable values in the “Earth’s Climate Engine” pdf of 30% albedo and 20% atmospheric absorption giving a maximum of 50% heating potential of ~683 W/m2 at the equator or ~58°C.
No-one really KNOWS if their conjectures are right but it is reasonable to say nearly every part of the “greenhouse effect” hypothesis is wrong.
Referring to the Petty diagram the claim for CO2 absorption is that CO2 absorbs ALL surface radiation in the bandwidths shown in the graph – from about 14 – 16 micron in the graph
Therefore ALL the radiation measured by the satellite in those bandwidths is from atmospheric CO2 !
This infers that CO2 radiates at a power significantly lower than the “surfaces” – something that must be true given the mass of atmospheric CO2 per cubic metre is very small.
Is the atmospheric CO2 radiating at “effective temperatures” of less than 220 K as inferred by the Planck curves shown at heights in the troposphere where air temperature is always significantly higher ?
Does CO2 absorb ALL the surface IR only to finish at a temperature of 220 K ?
That makes no sense at all !
Rosco,
I want to get back to that composite of radiation measurements made by the Nimbus satellite, because I’m not quite seeing what you are saying:
You wrote previously:
As I said however the “peak emission” value is only true for a wavenumber plot – a wavelength plot has emissions at these values on the fringe of the curve.
Well, as I look at the above figure, I see a wavelength scale at the top and a wavenumber scale at the bottom. Is this not both a wavenumber and wavelength plot? Or is something fishy going on in how the wavelength scale has irregular divisions compared to the wavenumber scale that has regular divisions?
The satellite observations only prove that climate psyentists expect a bigger cake by taking a bigger bite out of the cake. So fucking stupid.
Robert wrote :-
“you wrote previously:
“As I said however the “peak emission” value is only true for a wavenumber plot – a wavelength plot has emissions at these values on the fringe of the curve.”
Well, as I look at the above figure, I see a wavelength scale at the top and a wavenumber scale at the bottom. Is this not both a wavenumber and wavelength plot? NO !!!
Or is something fishy going on in how the wavelength scale has irregular divisions compared to the wavenumber scale that has regular divisions?”
OK – here goes.
We’re all familiar with Wien’s law which says that peak emission is related to temperature in Kelvin by the relationship :-
Lambda(peak) = ~2898/T – units of micrometres.
At higher temperature peak emission shifts to shorter wavelengths !
It is also available in other formats :-
So referring to Petty’s graph and using Wien’s law in wave number format we have:-
Peak emission for wave number = 1.96101 x T – units in /cm.
For 290 K this equates to 1.96101 x 290 = ~569 /cm.
Open an image of Petty’s graph in a window and open some other program window and place the vertical edge against the maximum of the 290 K Planck curve and observe the value on the x -axis is ~569 /cm.
To convert wavenumber – the number of waves in one centimetre – to wavelength you perform appropriate mathematical transformations.
For example if there are 1000 waves in one centimetre then there are 100,000 waves in one metre and this is equivalent to a wavelength of 10 micrometres. Look at the numbers on Petty’s graph to confirm – 1000/cm is equivalent to 10 micrometres !
Thus the transformation is wavelength = 10,000/wavenumber which is in the “Wien’s law all variables pdf on dropbox..
For the 290 Planck curve this becomes wavelength = 10,000/569 = ~17.6 micrometres along the top of the graph.
Comparing this to the graph shows it is true.
Every wavelength along the top of the graph is computed in this manner. So it is definitely NOT a wavenumber and wavelength plot !
The other versions come from transformations of the various forms of Planck’s law using wavelength, frequency or wavenumber as the independent variable.
http://www.spectralcalc.com/blackbody/CalculatingBlackbodyRadianceV2.pdf explains all of this quite well.
Now using the most often quoted version of Wien’s law we have Lambda(peak) = ~2898/T – units of micrometres. Most Physics text books quote this as it was the version derived empirically !
2898/290 = 9.99 micron – 10 micron but this is not where the peak emission occurs for a wave number plot !
Here is a version of satellite garphs from the COMET program that plot using wavelength as the x-axis variable.
As you can see the “bite” that represents the CO2 absorption band widths is shifted to the right away from peak emissions for a plot using wavelength as the x-axis variable.
I could transform all the x-axis wavelengths to wave number using the transformation wavenumber = 10000/wavelength and print then on the COMET graph but you can do a few for yourself and verify them against Petty’s graph.
For example the “spike” between 14 and 16 on the wavelength plot is about 15 micrometres.
10,000/15 = ~666 wavenumber which is exactly where it is in Petty’s graph.
Perhaps it is the devil’s number after all ?
Friends,
As someone who has the direct experience of being taught the greenhouse effect as part of my Environmental Science degree course at Lancaster University in the early 1970s, I have some comments from memory that I hope are useful:-
Joseph is correct. The cross-sectional area of the Earth’s disc is used to calculate the energy input of intercepted solar radiation. This process is used as a geometric trick to overcome the complex geometrical calculations of the actual intercept surface area of a planetary hemisphere, illuminated with the varying intercept angles of a (mostly) none vertical solar disc. So far, so good. But then we have the problem of the rotating Earth, clearly the solar beam illuminates more than half the surface area of the globe, and does so for each daily rotation of 23 hours 56 minutes. The issues of the extra 4 minutes needed to catch up with the sun’s annual track and the axial tilt are resolved if we average over a year, but the problem of the non-vertical sun never goes away as clearly the strength of the intercepted solar beam is always less at the poles than at the tropics.
Then we have the problems of energy output, in particular the requirement to “Radiate terrestrial energy away isotropically from the sphere”, but the Earth is not a point source, so “To overcome the obvious problem that the Earth’s surfaces are not some sort of superconductor instantaneously transferring energy equally over the Earth’s sphere they come up with the argument the Sun should have heated Earth as much as possible over billions of years.”
We are now in the realms of pure magic, and not even believable magic at that!
Joseph- The error which turns this into actual flat Earth physics pseudoscience comes *when the sunlight intercepted by the Earth is spread over the entire surface of the Earth at once, and is used as an INPUT*. This is the precise moment and step of the derivation where it turns into flat Earth physics and bad science, and pseudoscience.
I totally agree.
As a professional geoscientist of over 40 years’ experience I can find no evidence that Carbon Dioxide levels in the Earth’s atmosphere are anything other than a thermometer of planetary temperature and NOT a planetary thermostat. If we are increasing the CO2 levels, then all we are doing is re-calibrating the thermometer, nothing more and that is totally harmless. The biological benefits however of increased atmospheric CO2 are immense and by doing so we have increased the carrying capacity of our world.
Carl 2017/09/28 at 1:21 PM A brilliant History of Science list. Thanks.
Rosco,
Thanks, but I would have to take a lot of time to work through those numbers to understand what I was doing.
In the meantime, I did this graphic:
Tell me if my interpretation is correct:
The wavenumber graph (on the left) seems to show CO2 at its lowest emission in the 15 micron wavelength, where Earth is at or near its peak emission.
The wavelength graph (on the right) seems to show CO2 at its lowest emission in the 15 micron wavelength, where Earth is significantly below its peak emission.
This seems contradictory, and, if this is correct, then this contradiction seems to indicate that there is something wrong in what we are thinking that this is showing us about the relationship between Earth’s total emission and CO2’s supposed detrimental affect on Earth’s total emission.
So, what is this supposed to be telling us? — that CO2 is somehow sucking emissions out of Earth’s total emissions to heat us up? Well, if that’s the interpretation, then CO2 is one fickle little molecule, because it does NOT seem to “know” where it wants to do this.
I also noticed that the units of measure for radiance are slightly different on the two graphs:
The wavenumber graph (on left) uses “milliwatt per meter squared per steradian per centimeter” (Did I get that right ?– the graph seems to be missing a division slash), while the wavelength graph (on right) uses “watt per meter squared per steradian per micrometer”.
Anyhow, assuming that I have not shown how ignorant I truly am, I wonder what we are to make of all this. Isn’t radiance a proxy for temperature, and given that CO2 has such a low spike, why would these graphs not be showing us something about the temperature of CO2 or something about how CO2 LOWERS temperature?
Claes Johnson seems to proceed in a discussion along such lines at his blog, but, honestly, he seems to speak in such riddles and cryptic, evasive tones that I never see him get exactly to the point of clarifying this, which I find annoying. Maybe he wants to approach it at a level of changing the foundation of physics, and he finds it way to exhausting to try to explain everything that he would need to explain to make things clear in his preferred approach — I don’t know. Maybe I’ll go back over there and try to comprehend his explanation of the wavenumber graph again. Bottom line, he seems to think it’s telling us about temperature, and that the CO2 trough is some sort of “fiction”, to use his term.
Well, I found more detailed explanations by Claes Johnson at the following links:
http://claesjohnson.blogspot.com/2013/01/fiction-of-infrared-radiance-sensing.html
http://claesjohnson.blogspot.com/2013/01/how-to-interprete-atmospheric-spectrum.html
http://claesjohnson.blogspot.com/2013/01/the-ghe-decoded.html
I need to study these. I hope they present a viable argument, or else I will be brainwashing myself in another way.
I would be interested in JP’s take on all this, given that he as spent a bit of time with spectral analysis (if I remember correctly).
Alarmists always use Petty’s graph to show how CO2 traps heat coincident with Earth’s peak emissions and is therefore a big deal. They state this is absolute proof.
People like Roy Spencer state this shows how CO2 and other “greenhouse gases” lower the temperature Earth radiates to space.
I simply wanted to show that no-one can make absolute statements concerning one plot such as wavenumber.
Using the wavenumber plot it seems that CO2 is removing a large amount of radiation at the peak emissions.
Using the wavelength plot it is removing the exact same amount of radiation at wavelengths nowhere near the peak emission wavelengths. (This “exact” relationship may not be obvious in the COMET plot because it is a plot of a different time etc as the Petty plot. Both satellites would need to record at the same spot and time to show equality.)
It is equally correct to claim that a wavelength plot shows that CO2 absorption in the wavelength bandwidth are trivial.
The thing is both are right.
If you plot Planck curves and compare them you find that at equivalent wavenumber/wavelength values the radiance is equal.
For example at wavenumber 1000 from a Planck curve I plotted the value is 10.4490156 and the wavelength value for 10 micron is 10.4490156 to 8 decimal places. (The wavenumber value is 0.104490156 but this is per cm so multiply by 100 cm /m).
However I find it incomprehensible that radiation emitted to space from CO2 at an effective temperature of ~220 K from the lower troposphere where the temperature is ~254 K is a cause of warming ?
Similarly the radiation emitted to space in the wave numbers in the middle of the 1000 to 1100 bandwidth suggest an effective temperature of 270 K yet these are due to Ozone near the top of the atmosphere 20 – 30 km high. At 20 km x 6.5 °C per km the temperature is ~288 – 130 = 150 K.
So CO2 emits radiation at an effective temperature of ~220 K in an environment where the temperature is significantly higher whilst Ozone emits at ~270 K in an environment over 100 K lower ?
No-one should get away with making simplistic statements about any of this.
The arguments over “where is the TRUE Wien’s peak emission” continue without resolution.
“I would be interested in JP’s take on all this, given that he as spent a bit of time with spectral analysis (if I remember correctly).”
I’m sorry, I’ve been so busy with other stuff lately. Not quite sure what the question is as I don’t have the time right now to scan back. If it is about the long-wave absorption spectrum seen when looking down through the atmosphere, the answer is this: absorption spectra are not greenhouse effects!!!!!!!
An absorption spectrum is in NO WAY evidence of the radiative greenhouse effect!
And then if you do a Youtube search for “there is no radiative greenhouse effect”, look at all the bullshit that pops up…so sad!!
I found another wavelength plot at … http://studylib.net/doc/13645874/review-of-remote-sensing-fundamentals
and I did another graphic to compare the Petty graph with it:
I don’t know why this is doing such a number on my brain, but it really bothers me that I am having difficulty finding a resolution of my dissonance with it.
I look at the CO2 bite, and compare it with the height of the spike next to it, and, basically, this relationship looks comparable on both graphs. So, “What’s the issue?”, I ask myself.
I answer myself, “The issue seems to be where this bite occurs in relation to the hump of the 300K temperature curve. On the x-axis-as-wavenumber, the CO2 bite is located almost directly under that hump. On the x-axis-as-wavelength, the CO2 bite is located well to the right of that hump.
So what? That’s just the result of the choice of variable for the x-axis. The wavenumber graph gives the visual impression of a big bite out of something, and that’s all it is — a VISUAL IMPRESSION, right? It says nothing about any real bite out of anything. The fact that the bite can occur in a DIFFERENT visual impression with a DIFFERENT choice of x-axis variable seems to fair will with what Claes Johnson says — it’s just a TEMPERATURE indication about the whole atmosphere, NOT an indication of net radiance between different gases, viewed in isolation, as neatly divided components of the atmosphere.
That’s where I am with it at the moment.
What the satellites sense is real.
The deception is the claim that coincidence with “peak” emissions in a wavenumber plot is a big deal because peak emissions shift in a wavelength plot and a frequency plot.
Planck’s equation is the same in each version but obviously “looks” different due to the changed variable choice.
The best I can say is to be aware of the reality.
Here’s an interesting thing to do – estimate the total power in W/m2 for the plot in Petty’s graph.
choose approximate geometric shapes for parts of the plot that look right to you and multiply the sum by pi.
To give you a start I chose the LHS portion as a rectangle of 200 /cm (x axis) by 100 mW ( y axis).
This is 20000 mW/m2.
I chose a right angle triangle on top of this with base of 200 /cm and a height of 20 (~120 – 100).
This is 200 x 20/2 = 2000mW/m2.
Choosing appropriate triangles and rectangles, summing all the areas and multiplying the sum by pi I got something like ~255 W/m2 as the total.
As Trenberth et al tell us it is 239 or 240 W/m2 this is interesting but certainly not alarming as, despite the “bite”, the total emissions to space appear to be completely OK according to the IPCC – maybe even a little on the high side ?
I think that the deception might be in devising a graphic that shows relative behavior of different atmospheric components, in such a way that the graphic ignores (does NOT show) the fact that one of these components (CO2) is only 0.04% of the molecules exhibiting this behavior.
In other words, a very small number of CO2 molecules would seem to make what appears to be a deep “bite” merely a barely visible hairline gap between two thick mountains on either side, as far as effect goes. Overall emissions consume that hairline gap, if I’m thinking straight.
It’s almost as if the graphic hides the most important dimension that allows us to properly establish a realistic point of view.
“Pay no attention to that man behind the curtain.” — The Wonderful Wizard Of Oz
How many people do you think are aware that the iconic Petty absorption spectrograph posted above that is viewed by far too many people as being representative of the entire global atmosphere both now and forever was just a “snapshot” taken in clear sky conditions near Guam on April 27th 1970?
1) How good was infrared spectrometry in 1972?
2) The assumption is that the surface (presumably of the ocean) near Guam on April 27th 1970 was emitting a perfect “blackbody” waveform and therefore the “notches” in the waveform are all due to atmospheric absorption and not due to irregularities in surface emission.
3) Look at the size of the “notch” that is said to be caused by CO2. Even if that “notch” is caused by atmospheric CO2, how much more energy exists at those wavelengths that higher levels of CO2 might absorb? Most of the energy at those wavelengths is already not getting through!
4) Do the “notches” that are present in this spectrograph actually correlate with higher surface level air temperatures or is that still just a hypothetical? We do know through observation that high humidity correlates with lower surface level air temperatures.
That’s a good fact to know, Carl. I, for one, did not know that.
Yes, so ONE snapshot represents all Earth. That’s quite an assumption, … on top of the assumption that black-body reasoning can be applied to an entity with a gaseous layer, … on top of the assumption that the reading is a real measure of radiance.
It’s suspect on so many levels now.
A slightly philosophical addition to the discussion. Assumptions are incredibly important as has been roundaboutly illustrated in this discussion as well as others previously. It cannot be overstated. It was hammered into my head all throughout school by a number of my professors. And this is my quip on the matter here.
Quality of assumptions constrains quality of solutions.
AKA GIGO. This is slightly more advanced but follows on from the same principle.
Example: Using Newton’s laws we can calculate a lot of useful things to help design and build all sorts of devices that would work. If we tried to fly rockets and put satellites in orbit it would never work, because the assumptions of Newtonian mechanics no longer apply in the real world environment that we are attempting to function in.
As JP pointed out the assumptions made going in were totally valid. However, the limits of those constraints were subsequently and unceremoniously tossed right out as soon as they were done with them. Unfortunately this leads the climate clowns down a very erroneous path and their group-think religion is so strong, that they literally cannot see out of the fantasy they have constructed for themselves.
The absurdity of these poor assumptions is illustrated in all of the physics on a first order observation. SB shows it, but they abuse that. The Planck Einstein relation shows it incredibly clearly (As if SB wasn’t enough). They abuse and ignore that too. Conservation of Energy make it obvious as well. Literally all of physics rebuts their shitty notion, but they would rather construct ever more complex nonsense armor in order to avoid their catastrophic errors which are staring them in the face.
Honestly, I would have absolutely no problem with their desire to live in a house built of shit, but I am 100% unwilling to join them in their idiocy. And that is the rub (a brutal one at that). They wish to force all the rest of us to live in a house of shit that they built. I say no to the tyrants, my brain is still functional.
Well said!
Thanks JP.
Furthermore ,
If these climate clowns were so correct in their prognostications where are all the useful devices that could be constructed using their supposed expertise? I know JP has asked this of some of the “skeptics” before, but I have yet to see anyone put their money where their mouth is: Has any of these “experts” provided a business venture where these magical features of the BARGHE (pronounced BARF- acronym being Bullshit Asshole Radiative Green House Effect) phenomena can be harvested to make money?
Sorry for the terse vocabulary, but these people are so far out of control I think being polite with them is going to end badly for a lot of decent people. As history as shown. It (Leftist controls of energy under the guise of saving GAIA) already causes tremendous difficulties for many people due to energy useage restrictions. Undoubtedly, many people already suffer unnecessarily as a result of their Al Gore fever.
Let’s cool a container of CO2 down to 220K, and use its radiation to warm stuff up by slowing down how fast the stuff cools. Patent number BS000000000.
… or Sooooooooo BS
I’ve had arguments with a guy who calls himself Ed Bo. He continually highlights NASA’s testing equipment where they can induce near vacuum and any temperature they want down to approaching zero – allegedly.
As NASA GISS is a huge promoter of “greenhouse science” I suggest it would be almost trivial for them to demonstrate the “steel greenhouse” hypothesis by experiment.
A battery powered heater inside a sphere with a close fitting shell inside their testing chamber.
All components held in vacuum with no contact by magnetism and turn on the heater and see what happens.
If we have the technology to detect gravity waves why can’t someone “prove” their hypothesis ?
Probably because it isn’t real.
I like it Robert K.
My personal desire is an ice powered BBQ grill. Nothing like loading a bucket of -20F ice into a BBQ pit and cranking out a couple of ripping hot 500F surface temp steaks. (Medium rare please).
Rosco,
I am certain NASA does have such thermal vacuum test chambers. A friend of mine worked on the unit that was being built for the James Webb Space telescope test setup. That was around a decade ago when he left our team due to political destruction of MSF.
I don’t think it even needs that much equipment to test. Just show me an instance where you put a 1000 degree brick (or whatever if you prefer something with a different BB property, it can/should be optimized) preheated into a test chamber with a block of ice and show me the temperature of the brick going uphill of 1000 degrees after t=0. I know, you know and Joe knows it ain’t going to happen.
Can you imagine how rich we could all be if only we could cook steaks with ice?
I ran my own ultra-high vacuum lab for ground calibration work, and have used both the Canadian Space Agency’s and Indian Space Research Organization’s thermal vacuums on many occasions for various stages of spacecraft integration tests. I have spent lots of time with thermal vacuums and the engineers who rig them. Cooling is typically provided by liquid nitrogen, which is cold enough for most solar-system work.
Heating is done with electrical resistors, and you know what the TVAC engineers don’t need to consider, have never considered, and has never affected them?
Anyone?
*Backradiation from the chamber walls.*
That’s what.
It would be SUCH a common thing, and such an important thing, that anyone who ever designed a TVAC system (there are labs in undergrad physics and engineering laboratory courses at many institutions where you do just this, let alone the government labs) or who had any contact with one, especially people who test spacecraft in them, would know that you have to watch out for “the backradiation coming up” and causing an overshoot in the temperature you are trying to get to, which could be quite unhealthy depending on the hardware. Too high of temperature can equal damaged components. These TVAC systems would be ALL ABOUT how you need to turn on the heaters, but then watch out for additional backradiation heating. It would be a feedback in the system that these system engineers and physicists would have known about since the development of thermodynamics in the 1800’s, and then especially again during the Space Age. All Mercury, Gemini, Apollo and Shuttle astronauts would know about this “physics”, as would all spacecraft engineers and TVAC engineers. There would be tables for it. There would be formulas for it. It would be such a commonplace concern that it would feature in any basic undergraduate physics degree.
But it’s only found in climate alarm.
And astronauts and related engineers only worry about absorptivity and emissivity. They don’t use “backradiation heating”.
You only need to worry about thermal radiation from the chamber walls when they’re WARMER than the thing that you’re trying to cool.
If they’re colder than what you’re trying to heat, they don’t add any more heat to it! They don’t increase its temperature.
DUH!
A patent Green-House-Effect advocate’s response to JP would be: “You clearly do not understand the basics of thermodynamics.” (^_^) … so pathetic, … and yet such a joke.
I’m thinking about introducing a new injury lawsuit based on spinal injuries from so much head shaking over stupid “greenhouse effect” claims. But whom would I sue? — I guess I would take it a case at a time.
Yesterday, I was reading this again:
https://skepticalscience.com/saturated-co2-effect.htm
I could tell how much I have evolved, since the last time I tried to wade through it about a year ago.
Confuse concepts much, skepticalscience team?
I read through the article that you referenced at skepticlscience and it makes this statement, “The air doesn’t just absorb heat, it also loses it as well! The atmosphere isn’t just absorbing IR Radiation (heat) from the surface. It is also radiating IR Radiation (heat) to Space. If these two heat flows are in balance, the atmosphere doesn’t warm or cool – it stays the same.”
The article then goes on to explain how adding carbon dioxide to the atmosphere, which increases the emissivity of the atmosphere, causes the atmosphere to emit less energy into Space. This is 180 degrees out of sync with reality. Most physicists know that increasing the emissivity of something induces it to emit more, not less, electromagnetic radiation at the same temperature. The idea therefore that adding highly emissive gases into the atmosphere will force the atmosphere to become warmer is simply false. In the minds of the true believers in the “greenhouse effect” hypothesis carbon dioxide only increases the absorptivity of air; it does not simultaneously increase the emissivity of air.
You will also notice that the article immediately jumps to analogies and cartoon drawings of the atmosphere rather than pointing to any actual empirical data that supports the thesis of the article. For example, the cartoon drawing of the atmosphere in which increasing the concentration of carbon dioxide increases the “altitude of heat loss” is a picture of what the author of the article is “imagining”. It real life it has no connection with what is actually happening in the physical atmosphere. The “scientific method” was specifically created to differentiate between that which exists only in the imagination of men and that which actually exists in the physical world.
@Robert Kernodle says:
2017/10/06 at 11:10 AM
Hahaha .. hahaha .. I am just laughing my rear end off at the SkepticalScience article you pointed to. Oh, My, God … the very first cartoon they refer to (https://skepticalscience.com/pics/co2SaturationMyth_tank1.jpg) completely destroys anything else in their article. That has got to be one of the most ridiculous analogies I have ever seen. According to that cartoon, any restriction of the “outflow” would cause an overflow, with just a matter of time when it would happen depending upon the magnitude of restriction.
That is so absurd it is difficult to comprehend. According to their cartoon analogy, 1 single PPM of CO2 above the magic “balance” (whatever that is) would cause a runaway cataclysm that would fry our planet to cinder. The very thing that they are saying doesn’t happen .. because …
SkepticalScience is such a joke. I have never seen anything on that site that even resembles actual “science”, but then what would one expect from a self-employed cartoonist that dabbles in Nazi fantasia? … SkepticalScience needs to be sued, with a class action suit for spreading dangerous propaganda.
https://earthobservatory.nasa.gov/Features/Nimbus/nimbus2.php
“The Earth’s Radiation Budget
When it comes to climate and climate change, the Earth’s radiation budget is what makes it all happen. Swathed in its protective blanket of atmospheric gases against the boiling Sun and frigid space, the Earth maintains its life-friendly temperature by reflecting, absorbing, and re-emitting just the right amount of solar radiation. To maintain a certain average global temperature, the Earth must emit as much radiation as it absorbs. If, for example, increasing concentrations of greenhouse gases like carbon dioxide cause Earth to absorb more than it re-radiates, the planet will warm up.”
Here is a graph showing “heat trapping” recorde by the Nimbus series of satellites for the period 1979 – ~2005.
Note 2005 was the 40th anniversary of the Nimbus program, the prime reason for the website, so one must wonder why 40 years of data is not shown ?
Surely a positive anomaly is counter indicative of “heat trapping” ?
But Rosco,
surely a few femto-seconds is plenty of time to … “trap heat”,
… and surely one in twenty-five hundred molecules doing this femto-second “trapping” is enough to heat the atmosphere, … especially when it enables a hundred water molecules in that bunch to “trap heat” in a similar interval. The other twenty-four hundred molecules, working over considerably longer intervals, have nothing to do with it. (^_^)
And never mind that I am confusing the concepts of “heat” and “radiation”. That’s just semantics, which is not important to the myth (I mean “truth”) that I am trying to expound.
If heat can be trapped, then all I have to do is breathe forcefully into a paper bag, wait a few femto-seconds for back radiation to slow down the cooling of the air in the bag to heat up this air, and then open the bag to a glorious breeze of hot air whisking across my cold face. No need for steel shells, you see — a paper bag works fine, … AND it is a cure for hiccups, to boot.