
In my recent book, I made a big point about flat Earth theory being the jewel of modern physics, and how flat Earth theory has been presented as the most important political contribution which science has ever made for modern man via climate alarmism.
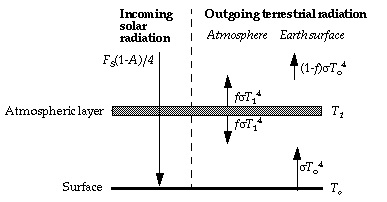
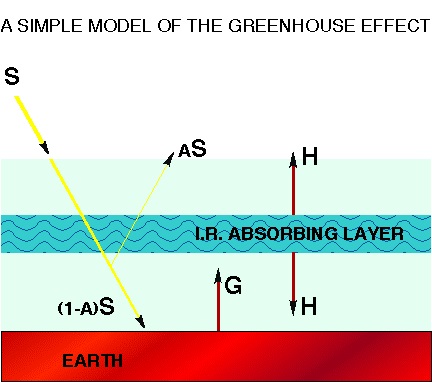
Recall that the founding diagrams of alarmism from which they create their alternative and fake version of the greenhouse effect are as shown in the next figures below:

Penn-State
Harvard
Columbia
You will note, with half a brain, that those figures represent the Earth as flat and with 342.5 W/m² as the solar input (which after other factors applied comes out to -18°C as heating potential).
Perhaps a less-technical looking diagram would help simplify things for you?

Modern physics. This is modern physics. This is what modern physics thinks of the Earth and the Sun.
The above diagram is modern physics. The above diagram is quite explicitly what modern physics thinks of the Earth and the Sun via its climate alarmism. The above diagram is what myriad scientists are publishing scientific and physics papers about in professional academic journals, what they’re getting paid to teach children, what they’re getting paid to research, and what they’re presenting as a basis for the most important political action which they have ever recommended to society. The above diagram is the basis of the three before it, the basis of climate physics and climate alarm as taught the most expensive Ivy League universities in the world.
Since I cannot resist philosophical and logical paradoxes, I must ask you: What is the distance of climate alarmism’s and modern physics’ flat Earth away from the Sun? The Earth of the above 4 figures..what is its distance from the Sun?
We can calculate it from those diagram’s numbers: they list the solar input as 342.5 W/m². Since we know the effective temperature of the Sun’s photosphere (5778K) and we also know the Sun’s radius (6.96 x 10^8m), then we can calculate the distance (d) at which the Sun’s light produces a flux (F) of 342.5 W/m² given the inverse square law. The equation is as thus:
F = σT4 * RSun2 / (RSun + d)2
Solving for d:
d = (σT4 * RSun2 / F)1/2 – RSun
and then inserting the necessary terms, you find
d = 298272585139 meters.
Given that the standard astronomical unit, or mean distance of the Earth from the Sun, is 1.496×10¹¹ meters, then this means that the Earth of modern physics, the Earth of modern physics’ climate alarm, the Earth of Ivy League university, the Earth of the modern academic peer-review system is:
298272585139 / 1.496×1011 = 2 times distant from the Sun than the Earth is.
And so in modern physics, the distance that the Earth is from the Sun is twice the distance of the Earth from the Sun.
How does that strike you?
The other major portion of my book was in explaining how it is possible for science to make a mistake like this. The truth is that science can make a mistake like this because science is chalk full of really stupid, incoherent, meaningless, and actually un-understandable mistakes that it actually holds as its basis and its most celebrated theories! That’s the truth of science.
Scientists couldn’t recognize a mistake or an incoherent idea if the Earth was presented as flat to their face… Oh, wait!!
Modern physics and modern scientists are actually predicated upon believing in incoherent and meaningless ideas which are obvious mistakes. To be a modern scientist, you must reject the use of reason and instead accept the sensation of cognitive dissonance as the standard for truth and that which must not be questioned. The cognitive dissonance of the modern science practitioner is thus actually a form of faith, because they actively choose the cognitively dissonant as the standard for truth and as that which must not be questioned!
Scientists think that the peer-review system and process will weed out mistakes….and yet, flat Earth as its most important political contribution to modern man is fully peer-reviewed and accepted science. And the other incoherent bases of modern science are likewise peer-reviewed.
And so that’s how science can make this mistake. It can make this mistake with consummate ease. This is precisely the type of mistake one would expect science to make once one understands the cognitively dissonant psychological requirement of being a modern scientist.
It’s time for a new science, for a rationalist science which is actually informed by the intellectual tradition and which rationally solves seemingly incoherent problems instead of accepting that plainly irrational, illogical, and paradoxical things form the basis of existence.

Maybe that would have been a better cover page Robert!
Well, yes, that image was in the running, but I guess I never pushed it, partly because the sun part of the icy sun had those primitive lines from my very first rough attempt. But now it seems appropriate, since those primitive, childlike lines mixed in with the ice drips, fit an undeveloped mind better. It’s like radiating “heat waves” confusingly mixed with icicles, hanging over a cartoon flat Earth.
Of course, if the sun were to scale, it would probably be invisible, so, on a cosmic scale, “greenhouse” folks have a practically invisible star, at the distance it would have to be to do the “greenhouse” thing, HEATING the flat Earth.
The symbolism of stupidity trumps any attempt at proper scale here. (^_^)
As an exercise, I’m going through “Harvard damn University” CHAPTER 7 on the “greenhouse effect”:

Since you do not like the use of “average insolation” to create a simplified description of earth’s heat flow because the behavior of the system is not linear (in particular, T^4 emissions), how do you accommodate the use of ideal gas law formulae to compute the expected surface temperature due to pressure, given that the behavior of any given packet of air in any air column is not thermally isolated from its surroundings, and is not measured by moving that packet from surface to stratosphere, nor vice versa?
After all, averages and ideals are just that: not real models of reality.
There are valid averages and there are invalid averages. There are averages that physically correspond with reality and in-situ measurements of reality, and averages that have no meaning. Average insolation is the latter – it is not measurable and it not a measured value, and has no meaning, and cannot replicate in-situ physical responses and behaviours of the system.
Flat Earth with average insolation is not a simplified description of Earth and its heat flow: it is invalid, full stop.
The average in-situ and real-time influence of a large number of particles does result in the measurable quantities of pressure, temperature, etc. The averages embedded in the ideal gas laws are real-time, in-situ quantities that can actually be measured, and have real-time influence. Average insolation is no such thing. Flat Earth is no such thing.
The averages in the ideal gas law are about the net effects which a very large number of particles have in real-time and which have real-time influences.
This is entirely different than average insolation which embeds a flat Earth requirement in its creation, and which is not measurable and is not about real-time influences.
You really didn’t intuitively grock all that, and needed it to be explained?
Average visitors per day has real meaning and real application. Average cost of stock in a given day does not. All averages are NOT meaningful. This is where intelligence comes into play, … to judge intelligently when an average has real meaning.
But on with the analysis of Harvard:
It’s a minor point, I guess, but could someone please explain to me how that second highlighted passage has any clear grounding at all. What the hell is “mean position” — mean position of which particle or particles (the whole ensemble??), … around what position of what particle?, ensemble center?? … and which university is this again?
It just looks like razzle-dazzle lingo to make readers (students–God help them!) think the teachers are competent, ’cause they use biG wuhrds.
They just mean, say, like a box containing gas, and the gas of course moves all around and over time their mean position is that of the center of the box. But yah…kind of a stupid thing to have to say. Kind of really stupid.
Just to dwell on the point: What I see is an object, recognized as a defined entity, then reduced to its particles, now wanting a mean position of its particles. But where’s the reference point now to determine the mean position, if its particles ARE the now moving conceptions and not the solid? I see a solid/particle confusion that is not resolvable in a description that confuses the two. Which comes first, the object or its particles? Which conception do you then use to locate its center, around whose mean the particles move? — move how? – not as a unified mass vibrating all at once the same way, right? — so how? What is moving? — each particle? — with respect to what? — all the particles? — with respect to what common location? — moving orbitally?, … radially? … randomly?
I cannot find any traction in those words.
Could they not have used the concept of center of mass to make a more coherent statement? As is, I (the student) am left dangling in particles with no reference location to determine a “mean”. But thanks for trying to salvage their words. (^_^)
Joe wrote: “You really didn’t intuitively grock all that, and needed it to be explained?”
Since we disagree, somebody needs explaining, surely.
The only way the ideal gas laws apply is when a packet is transported from one pressure level to another… without any energy transfer in or out of the packet. There is no such condition when two different packets are involved. Certainly this is obvious from the fact that inversion layers exist, and hotter zones in the stratosphere occur. In particular, we can measure P, and T, but what’s V, since there are no container walls?
I become quite concerned when the chief argument from some people is the application of the gas laws to explain temperature differences, when it is absolutely measurable that such stratification does not exist on the planet, and certainly there is constant and variable energy transfer from/to any designated packet to/from those around it.
If this does not trouble you, why not? Is it not just as bad — reducing the atmosphere to a simplistic application of the gas law, ignoring the environmental deviations from them that are observed — as reducing the climate description to an average of absorptions and emissions projected?
Wait a moment. So now my comment is worthy of “moderation”, because I question the dogma?
No, but because your comments don’t make much sense.
There IS a temperature gradient in the atmosphere. It IS explained by an application of ideal gas laws via differentials.
Joe: the problem is that the temperature does not smoothly correlate with pressure. There are inversions, and other temperature events due to such things as condensation. It’s not as simple as some sort of perfect match-up with pressure and temperature. Using the gas laws to predict surface temperature is an oversimplification, based upon an improper model of the atmosphere, not least of which is the fact that the atmosphere is not composed of “ideal gas”. In that sense, it’s no different than the oversimplification done by the warmists: there is no simple model. The temperature from surface through the Thermosphere goes up and down a lot, because of the serious intervention from cosmic rays and solar wind. Even in the Troposphere, there are irregularities. It seems disingenuous to me to reject the bogus warmist oversimplification, but then embrace the oversimplification of declaring that all is explained by the ideal gas law prediction, when it simply doesn’t work except in the lowest altitudes while ignoring cloud formation and frequent temperature inversions.
Note: https://www.weather.gov/jetstream/layers
I think that your examples are the exception which prove the rule. Inversion layers and other such things have physical explanations and known mechanisms which result in the differences from Ideal theory.
I agree that the system is complex, and chaotic. The concern is the troposphere though, where the “greenhouse effect” is said to operate, and where the ideal laws would apply. Outside of this region, the total energy content becomes negligible even though the temperature and other things become non-ideal and wild.
It certainly is possible to reject certain degrees of oversimplification…for example when the oversimplification goes all the way to flat Earth theory. Other oversimplifications are not so bad, and can inform of general principles even though there are explainable exceptions to the general principles. There is no validity whatsoever or general principles, though, in flat Earth theory full of paradoxes.
It is good that we agree that the system is complex, and chaotic. Unfortunate that we cannot agree that translation of a highly constrained teaching aid like the ideal gas laws, with constant number of molecules and deliberate isolation from other sources and sinks for energy, somehow can deftly and simply explain surface temperatures. I’ll leave it with this parting comment: even ignoring the constant presence of counter-examples to the application of the gas laws inside the troposphere — the fact that the atmosphere is by no means an “ideal gas” in behavior, and no pair of “packets” (identical in composition and mass) from anywhere in the atmosphere would be expected to match in P, V, and T agreement because of those non-“ideal” factors — it definitely strikes me that ignoring the behavior of 20% of the atmosphere above the troposphere is a glaring oversimplification, particularly since every last joule of energy incident upon, and departing from, the earth passes through it, and materially affects it.
Just as it’s no good for the warmists to contrive an explanation that’s all about CO2, it’s just no good to take a chunk of the atmosphere, assign an “average” behavior to it, ignore all the deviations and call the explanation satisfactory.
Since it appears we will get nowhere with this, you have the last word, if you like. Well, of course you will, since it’s your blog, after all.
It seems disingenuous to me to reject the bogus warmist oversimplification, but then embrace the oversimplification of declaring that all is explained by the ideal gas law prediction, when it simply doesn’t work except in the lowest altitudes while ignoring cloud formation and frequent temperature inversions.
There’s oversimplification, and then there’s claimed simplification that really is a false claim disguising absurdity. The bogus warmist variety is the latter. The gas-law prediction, thus, might be, at least, a step up from that.
what convinces you earth is a globe?
As I pointed out, your exceptions to the rule, in this case, prove the rule, because they are explainable as exceptions to the rule via known mechanisms which cause deviation from the (ideal) rule.
I agree that there is a lot going on, and I wish for actual climate science to do science with it. For anyone to do that, they need to realize that this alternative greenhouse effect idea of theirs is bunk.
Reason.
Do I have this correct?
Mean solar radiation … is a fiction.
Yes, good. The disk cross-section for the total intercept of light is fine, and obvious, but then yes, you point out that it is actually then spread over the entire surface of the Earth at once! Sure, that’s a mathematical mean…but it is not PHYSICAL, not what’s actually happening, not what is actually driving the system, not how the physics of reality is actually playing out in cause & effect in real time. That mathematical average, while can be done on paper, is not physically meaningful. And you simply need to point out that that average makes sunshine -18C, and so, meaningless because we know that sunshine can melt ice, etc.
Yes, the disk-cross-section-total-intercept for the half sphere is provable mathematically, via calculus (an integration of some sort, I think).
But the f**k up comes at proposing to dilute this correctly-derived quantity, by spreading it over the whole spherical area at once. What rule would allow this? — there is no equivalent calculus maneuver to un-integrate it and then divide it to make any meaningful dimensional continuity in the operation.
Light cannot be conceived to bend around a sphere in a similar way that light on a half sphere can be conceived to “bend” onto the sphere’s cross sectional area. Light from a point source cannot be conceived as an average illumination around a globe. Unless it is some kind of weird-shit light that this world has never seen. (^_^)
The compression from half sphere to disk is a correct numerical treatment for physical reality.
The expansion from disk to sphere is an incorrect numerical treatment for physical reality. There’s nothing in reality that such a mathematical maneuver represents.
Pingback: Flat Earth in Modern Physics: How Climate Alarmists are using Warped Science - SUBNOMICS
Good article. I would add not only is the Earth round-ish, the surface is not uniform. On land you have changes in elevation and surface composition to consider. And of course the surface area of the oceans are in a continuous state of flux due to several factors.
In other words, I would expect a desert would generate more heat than an equal area of marsh land. And as I understand it, daily temperature swings in a desert can be quite large.
Also, how does the specific heat of water affect this calculation? Beyond the ability to absorb IR, doesn’t water act to both to limit heating in the day and retard cooling at night?
And of course water transfers energy to the atmosphere in the evaporative process, releasing that energy when it goes from vapor to liquid in large part I assume because of the pressure gradient. It doesn’t appear evaporative cooling is part of the model.
“Also, how does the specific heat of water affect this calculation? Beyond the ability to absorb IR, doesn’t water act to both to limit heating in the day and retard cooling at night?”
Areas with higher water content are generally lower in temperature than areas at equal latitude but which are dry. While water content does indeed lessen the swing in temperature, i.e. in comparing a humid area to a dry area, the temperature of the humid area is on average less than the dry area. The dry area gets much warmer, and while it cools drastically, the cooling is not enough to offset the high and so the average is higher for a dry area as compared to a wet area. Ice-ages are of course quite wet, i.e., the land becomes saturated with water, etc., thus cooler land on average, allowing the formation of low-latitude snow pack, etc.
Yup, the world is not quite round, but it does sort of average out. Last time I looked at the NASA model code, it used the trigonometric reduction appropriate for the location of the ground “square” being illuminated: in the middle of the insolated area, it was 100% of the “disc” illumination for that sub-section, while at the edges of illumination (slightly over half the “sphere) there was almost none for those “squares”. That seems pretty close, to me. Did I miss something?
[JP: Yes. They parameterize the flat Earth greenhouse effect into the model.]
With regard to the “half” at time, of “full” at a time, isn’t it a matter of nobody wanting to generate a pattern that requires “time” to discuss the subject, and therefore wants it reduced to just the total illumination for the whole day cycle of each grid section? The seriously unphysical part, of course, is the fact that outgoing radiation cannot be linearly averaged from a fourth-power emission generation. Still, it looks to me like it was to just arrive at a snapshot average, rather than a daily animation showing a cycle. Ever looked at the Apollo thermometer graphs? Seriously steep drops in temperature for the first few hours after sunset, followed by a almost flat “night” temperature. But the daytime temperatures are more sinusoidal going up then down, indicating while there’s a pretty cold “floor” temperature, the daytime temperatures don’t saturate.
Pingback: Science History Shows Flat Earth Success | Climate of Sophistry
Pingback: The Purpose of Climate Alarm | Climate of Sophistry
Pingback: The Purpose of Climate Alarm | PSI Intl
Pingback: Illuminism, Meritocracy, and Propertarianism | Climate of Sophistry
Pingback: Climate Change is Fake Because Earth isn't Flat | Flat Earth Tribe
Well…if you don’t like using the average, use the total energy of 173.5 petawatts.
The forcing, F is in watts per meter squared on the left side of the S-B equation. This would be the energy from the sun.
The S-B constant is in watts per meter squared per K4 on the right side of the equation.
All you need to do is get rid of the per meter squared by changing to total power.
On the left side, Use 173.5 petawatts.
On the right side, multiply by the number of square meters on the surface of the earth (sphere).
No flat earth involved and you still get the exact same result, but then there never was a flat earth.
[JP: That’s all fine…but it is not the average which drives the physics. They present the average as being the thing which drives the physics.]
Regarding a half sphere argument I noticed here, the problem is we have a rotating sphere. Sure the energy falls on only one half at any one time, but then we are concerned with the total sphere, not just half. For example, take a single square meter near the equator, and rotate it through a 24-hour period in one meter increments. Calculate the energy at each increment, and sum up the energies. The square meter will experience zero energy for half of the increments. The sum will be the total energy seen by the square meter over the course of a day. Divide by the total number of increments, and you get the average energy seen by the square meter. If you pick the square meter that sees the full solar constant at high noon, the average will be about 426 watts.
I know from some of the comments that average is a difficult concept to grasp. But let’s use an example. Let’s say your want to know the average temperature over the course of a day. You can use hourly measurements, sum up the values, and divide by 24. This is exactly what is done with energy.
BTW, this summing process is numerical integration, which can be done using a spreadsheet and doesn’t involve any advanced mathematics.
[JP: It is not the average which drives the physics. Yet they present the average as what drives the entire physics. Because the average cannot drive the physics of what actually occurs, the ad hoc scheme of their greenhouse effect is invented to do that.]
Joe Postma: Interesting that you just now post responses to year-old comments, but perhaps that’s just a glitch. You wrote: “They parameterize the flat Earth greenhouse effect into the model.”
My comment said exactly that, but in defense of the treatment by the NASA model code. The model doesn’t treat insolation as equal everywhere, but actually spreads the energy delivered to the earth’s cross-section according to the angle of incidence. Now, that’s not a defense of the rest of the model’s shortcomings, but it’s definitely not pretending the earth is flat.
If, instead, the complaint is not using fully dynamic flux expressions, accounting for insolation and varied methods of cooling, including radiative emission,which varies by hour of the day, then I remind you that you don’t present the data that way, either. Instead, your “round” illustration is still static, and simply pretends that earth is somehow homogeneous at each longitude. Complain about one use of averages? Then you should complain about your use of averages, too.
[JP: Tom what a stupid thing to think that an astrophysicist (myself) would present a spherical model of the Earth which is static. Only your brand of pseudo-scientists would do such a thing…but they go even further and present the Earth as both static and also flat. Wow, climate alarmists are flat Earthers!
And yes, even when writing a 3D model, the climate alarmists still parameterize the mechanics of flat Earth theory into the model, thus polluting it with pseudoscience, i.e., the parameterized greenhouse effect. And this is why the climate models run hot and have been empirically refuted. Sorry not sorry Tom, you lose.
I’m sorry that the best you can do is flat Earth theory, Tom. Rather embarrassing on your part.]
“[JP: It is not the average which drives the physics. Yet they present the average as what drives the entire physics. Because the average cannot drive the physics of what actually occurs, the ad hoc scheme of their greenhouse effect is invented to do that.]”
The average is a convenient shortcut for a full integration. “They”, in their models, use the full integration. Just because the average yields the same values is not a reason to make such conclusions.
Again, no flat earth is involved. To claim “flat earth” is to deliberately distort concepts. Of course you can use a flat disk to calculate the total power intercepted by the earth. But that’s where you stop with the disk concept. Further, your Which One? graphic from tomhwp1013 showing a simple atmospheric model is just that; a model. You can do this and still generalize the concept to the complete spherical earth without invoking “flat earth”. WE talk about energy and power flow through a surface, aka W/m^2. A square meter is just part of a spherical surface. When you get to just a square meter, the curvature is minimal and you get that looks like a flat surface. You cn do an integration over the whole sphere and get the same answer.
I recommend dropping the insistence that “They” advocate a “flat earth”. “They” do not. No one does. Use some imagination and recognize the actual surface for calculations is a sphere.
JP: an embarrassment, to complain about you using averages, while condemning averages used by alarmists? Your description even admits as much, with terms like “spherical average”, and “continuous hemispherical system input” (ignoring albedo), and “decreasing cooling rate” that not only has no numbers pinned to it, but also looks strikingly linear in spite of radiative cooling rates being very much closer to T^1/4 rates. Show me the single time-dependent calculus-based description of energy departing the surface that you use, distributed across land and water, by altitude and insolation? You should at least admit that not only do the models not correctly show that behavior, but neither do your illustrations, which don’t even attempt to GRID the surface, let alone detail each unique element of each grid position. Shoot, you don’t even observe that the rotational position of the earth affects outgoing radiation on the basis of the percentage of land or sea is facing toward, or away from, the sun: you average day regions and night regions, but not locations.
Your Masters/AstroPhysics — not to belittle your accomplishment — had nothing to do with heat flux, and your Astronomy degree doesn’t require it, either, so kindly stop using appeal to authority — your own — to defend your arguments. Surely a science degree bears on scientific method and numeracy in general, but not with regard to atmospheric chaos.
Your core error in the large illustration above — again, not to defend the “flat model” as somehow “better” — is the simple contradiction, first declaring that the “troposphere is naturally warmest at the bottom near surface”, then declaring that “heat flows DOWN temperature gradients from warm to cool”(coupled with “red” areas near the top). Did you mean to say that heat flows UP from the surface? Factually, heat flows from the sun to the atmosphere, where it is sometimes intercepted (certain wavelengths, and clouds), but the bulk of the solar input heats the surface first, since cloudless atmosphere is transparent to visible light. From there, heat flows upward until escape, sometimes intercepted (again, certain wavelengths, and clouds) and thus warming the atmosphere. And you still begin with the planar distribution of solar input, from which a little trigonometry divides the energy flux from that plane to the sort-of-sphere of the planet (but of course, that’s not entirely correct, either: the larger size of the sun, and the scattering in the atmosphere, does move some of that energy “over the horizon”. But, close enough for illustration, right?)
(Just curious: how do you square the use of the ideal gas laws — designed to show relationships in an environment with no other energy transfer involved — to be the cause of surface temperature by the Slayers group, when there’s myriad chaotic energy transfers involved in the travel of any molecule in the atmosphere?)
Last, your ad hominem approach to argumentation is hardly impressive, and certainly beneath your education. My Physics is from Dartmouth, and although I’m surely more distant from my education than you are, I know the difference between actual modeling, and averages for the sake of illustration of properties of a system. Flat Earther? Hardly. I complain about the models, too, as I noted in an earlier post (Computer Science was my third emphasis at Dartmouth, as well as my career choice).
I’m sure we agree that alarmism is false, and that CO2 is hardly our enemy. But getting the story straight is important, and ignoring radiative emissions effects in the atmosphere is not accurate, or useful in defeating alarmism.
Frank, the diagrams are for a flat Earth, with sunshine averaged over the entire surface area of the flat Earth at once. FLAT EARTH THEORY. This is quintessential flat Earth theory, this is precisely how a flat Earth theorist would derive the mechanics of flat Earth theory, with the result that the Sun cannot create the weather and therefore an ad-hoc non-empirically existent and miss-named “greenhouse effect” is then created to make up for the difference of the fundamentally flawed model.
Yes, indeed, they then generalize these concepts to a spherical Earth, parameterizing the pseudoscience of flat Earth theory, the back-radiation greenhouse effect, into 3D reality, thus rendering their models false. And of course the models did fail and ran hot. QED…finito.
Frank, this is flat Earth theory:
Flat lines as the entire Earth, with sunshine spread over the entire Earth. The very starting point of climate science. Flat Earth theory. Fully non-empirical, irrational, illogical, and ridiculous.
Here is what a spherical basic model would look like, and it explains fundamental things about the climate which the standard flat Earth theory get 100% wrong and cannot even explain at all…such as how the Sun creates the climate:
Please stop defending flat Earth theory you guys.
You are literal flat Earthers in every sense of the term. Total quack flat Eathers.
You dumb disrepsectable deplorable shit Tom. The average that the alarmists use is FLAT EARTH THEORY. It is 100% illegitimate. Do you not understand basic things? You are a flat Earther Tom.
My reference to “averages” is nothing at all similar to what the alarmists are doing and to claim that is totally disingenuous and an outright lie. You are a liar Tom. A LIAR. And a flat Earther. Of course you deserve no respect and deserve all ridicule and derision. You’re an embarrassing moron. A literal waste of space. A literal drain on society and human existence and the human gene pool itself.
Of course my model has rotation embedded in it and the flux is local, depicted by the shading. Only you interminable, unrepentant, and consummate pseudoscientific liars use a static non-rotating FLAT EARTH and claim that this is a reasonable model on the one hand, and then ASSUME that an alternative spherical model borne out of criticizing your static flat Earth is also static. You despicable cowards, you disgusting filth. You intellectual fraud, Tom.
My masters degree in astronomy had nothing to do with heat flux? Can you even state a rational sentence when you try? No Tom, it didn’t require heat flux, warming me up, to get my masters degree…other than the Sun keeping the climate warm for me to live in, which your flat Earth beliefs deny that the Sun can do. However, yes indeed, thermodynamics at the post-graduate level is indeed a part of astrophysics. Astrophysics is a super-set of physics, requiring a broad and ranging knowledge over all sub-area of physics because they ALL bear on astrophysics, and in particular: thermodynamics, heat flow, radiative transfer, quantum mechanics, classical mechanics, statistics, etc. In other words, I have all of the training that dumb-head meteorologists with a few undergraduate credits in physics LACK! haha
Yes Tom, my model demonstrates how the Sun heats the Earth and creates the weather.
The flat Earth model of climate science shows that the Sun does not heat the Earth or create the weather.
Pretty big difference wouldn’t you say? Oh…but…you prefer to invent irrelevant minutia to dismiss mine and defend flat Earth theory.
There is no climate atmospheric greenhouse effect.
Just a few comments @ tomhwp1013:
JP: an embarrassment, to complain about you using averages, while condemning averages used by alarmists? Your description even admits as much, with terms like “spherical average”, and “continuous hemispherical system input” (ignoring albedo), and “decreasing cooling rate” that not only has no numbers pinned to it, but also looks strikingly linear in spite of radiative cooling rates being very much closer to T^1/4 rates.
An even bigger embarrassment is tom’s failure to acknowledge that all averages are not meaningful averages — that some averages are meaningless, while other averages are useful and relate to proximate real-time and proximate real-space divisions over which they are figured, … as opposed to fake averages that are figured for times and spaces for which the given physical phenomenon does not even exist in those times and places to be realistically averaged!
What’s wrong with the phrase, “continuous hemispherical system input”?
What is even anywhere near right with the phrase, “average solar flux over the sphere”, used in the flat-Earth basic model? If tom cannot answer these two basic questions, then his Dartmouth physics credentials do not speak well of Dartmouth.
And how about criticizing the simple model being discussed, where Earth’s rotation is ignored, but instead tom complains about albedo being ignored in a simple model that, at least, makes an effort to be more realistic. Seriously? — when the main focus is on the main errors of the basic model? — he nitpicks details that such models are not intended to convey? Tom knows full well that basic models do not contain the level of detail that he is talking about, and to demand that level here, while ignoring that level in a lesser basic model seems underhanded. By doing this, he is defending the flat-Earth model, as he makes no attempt to find the greater realism in Joe’s attempt.
I could go on to comment on other parts of tom’s critique, but I’ll just choose one more:
I’m sure we agree that alarmism is false, and that CO2 is hardly our enemy. But getting the story straight is important, and ignoring radiative emissions effects in the atmosphere is not accurate, or useful in defeating alarmism.
The straight story is that college students are being exposed to a flat-Earth model and to flat-Earth math that does not prepare their minds for later advancement of understanding about Earth processes. “Getting the story straight” starts there, by getting rid of that garbage simple model.
And who is “ignoring” radiative emission’s effects? — tom is either pretending to be dense, or he really is dense, for not being able to comprehend that the effort here is to place radiative emission’s effects in proper perspective.
Radiation emission’s effects do NOT warm the Earth, nor do they “delay” or “slow” cooling by more than a few fractions of a second that are more than made up during Earth’s time in shadow. In fact, tom’s Dartmouth physics knowledge should lead him to conclude that radiation emission’s effects are largely to COOL, rather than to warm Earth’s atmosphere.
I can see that I have met my match. You are right Joe…those are flat Earth diagrams at the very basis of climate science.
Certainly, your spherical-Earth diagram showing that the Sun has the power to heat the Earth and create and sustain Earth’s climate and weather under such a geometry is not merely a quantitative improvement, but an entirely qualitatively different phase-space of theoretical, scientific, and cognitive development in our thinking of an energy budget for the Earth. It is clear to me now: we cannot believe that a model, such as the flat Earth feeble-sunshine models of climate science, which contradict basic empirical and theoretical facts, can tell us anything about reality or how to theorize about reality…BY DEFINITION!
There’s no point in defending the indefensible, and the basis of climate science in flat Earth theory, and its so-called “greenhouse effect” which is part and parcel to that flat Earth theory…is indeed indefensible.
I commend your new model as a much-needed new starting-point for approaching Earth’s climate and energy budget.
Signed…Tom H.
“Flat Earth theory.”
I think you assign too much importance to a simplified drawing of the earth’s energy budget. Simplified diagrams are handy to use and easy to understand. Simplified diagrams are a snapshot in time. Your spherical diagram is a step up in complexity, and I find it relatively easy to understand (except the greenhouse assertions. There we part ways).
Your spherical drawing is what climate scientists use, although they take it a step further and integrate over the sphere. This means the input energy, output energy, latent heat, albedo, etc will be different for each square meter. Convection will be different. Cloud cover will be different. Temperature will be different.
Some comments on your spherical earth diagram.
1. The power flux from the sun is actually 1360.8 W/m^2. This is the latest measurement, and is a minor point.
2. On the sunward side of your sphere, the input power flux is 480 W/m^2. On the other side, the power flux is zero. The average is 240 W/m^2 which is equal to the power flux out.
3. Latent heat does not describe the temperature of the earth’s surface, and does not set the average adiabatic temperature. I would like to see links supporting your assertion.
4. You state, “Heat flows down temperature gradients from warm to cool…” More accurately, net heat flows from warm to cool. All bodies radiate energy regardless of the temperature of other bodies. The net flow is what is what you are talking about. Convection is not constrained as tightly to temperature gradients. There, air masses are moved around and a cool air mass can be forced to mix with a warm air mass. Hadley cells. Thunderstorms.
Otherwise, your model is reasonable accurate.
Flat earth theory does not need to be defended because it doesn’t exist. All there is is a simplified diagram…and that’s it.
I assign the importance to those diagrams which they engender of themselves: the basis of climate science, as taught at universities around the world, as used to derive the climate “greenhouse effect”, as the basis for how climate scientists think of earth’s energy budget.
As such, what they generate for “understanding” is that of the mechanics for flat Earth theory, for how flat Earth theory would have to work and to be developed into a science, because they are a flat line representing the entire surface of the Earth which is thus flat Earth theory. As such, the logical and scientific flaw of flat Earth theory when developed into physics is that it postulates that the Sun does not heat the Earth or create the Earth’s weather, which is what these diagrams show. They then show an ad-hoc scheme to correct for this mistake of feeble sunshine which they label with a misnomer as “the greenhouse effect”, which has no empirical or theoretical support in the real world.
Indeed, the energy flows are all local and must all be treated as such, which is what my diagram shows, and which is what the basis of climate science flat Earth diagrams do not show.
Yes, the average is 240 W/m^2 output…and this cannot be used as a physical input since it is not the physical input. My diagram demonstrates this.
I did not assert “latent heat describes the temperature of the Earth’s surface and sets the adiabatic temperature.” The sentence is non-nonsensical and thus you’ve created a straw man.
Heat is the difference between energy emissions. Energy emission itself is not heat. Heat is only the net difference between energy emissions, which means that energy emission is itself not heat.
Yes, of course cold air can move to warm air regions due to wind. This is not about the thermodynamic restrictions and definitions of heat flow.
A flat line representing the entire Earth IS FLAT EARTH THEORY.
Flat Earth theory is the basis of climate science.
^That’s what Tom would have said if he wasn’t a complete degenerate scum bag^
haha! 🙂
No one needed to see what he actually wrote…the sick, sickly demented bastard. As if he pretends he’s a scientist…lol!
Again, the energy budget diagrams are simplifications of the actual system. A diagram is not a theory. Yes, the energy flows are averaged over the entire surface of a sphere. Everyone knows this. Energy flows are referenced to a square meter, and as such it is appropriate to show the surface of a square meter. This is a representation, not a theory. An approximation. Approximations are not theories.
Your diagram is a representation, not a theory. Your diagram is a simplification, not a theory.
As I indicated, integration over the entire sphere, considering the conditions of each square meter individually would be more accurate than either your diagram or the usual energy budget diagram. But even this is an approximation; a simplification. It is much closer the the real world than either diagram, but is still a model; an approximation. Climate scientists use the integration approximation.
No one, when using the usual energy budget diagram, thinks this is a “flat earth”. We all know the shape of the earth. What we are looking at is a representative square meter; an “average”; an approximation. Because we are considering a square meter, we can show it as “flat”. This does not change the fact that we are actually working with a sphere.
Getting back to your diagram. There is a statement made in the diagram, “-accounting for water vapor latent heat release, confirmed measured lapse rate with no “greenhouse” enhancement, thereby disproving the climate “greenhouse effect” “. This is at best an hypothesis. I asked for links supporting this hypothesis. You can provide actual data too if you wish. This statement is basically all I see wrong with your diagram. So…links, please.
Bottom line: to declare a “flat earth theory” is to play word games. And that’s all.
Stop lying Frank.
A diagram with a flat Earth is flat Earth theory, full stop. It embeds all of the pseudoscience of flat Earth theory, entirely. Thus anyone who utilizes such a diagram is a flat Earther, and at least an extremely lacking intellect. A pseudoscientist crank, such as yourself.
I see you trying to deflect away from responsibility to your own position. We all know that you are a flat Earther Frank.
The diagram presents the theory. An approximation can be good, poor, and completely invalid. An approximation of the Earth as flat with solar input spread over the entire surface is one things only: completely invalid. It is not even a theory or representative of a valid theory, it is simply outright false and wrong.
My diagram does represent a theory because it satisfies a few scientific things that the flat Earth model does not: 1) empirically consistent, 2) empirically observable, 3) theoretically consistent, 4) theoretically explainable.
Sure you know the shape of the Earth. But you nonetheless engage in flat Earth theory, and are literally to stupid to understand that when you draw a flat line and create the mathematics for a flat line that you are in fact performing flat Earth theory. Simple facts elude you.
Everyone knows the wet and dry lapse rates, Frank. Are you such a fraud in all this that you are not aware of those values and where they come from? Your only role is thus to come in and defend flat Earth theory…asking for references for basic facts everyone knows.
You’re a joke, Frank. And a flat Earther. That’s not a word game. It is basic geometry from grade school: a flat line as the Earth is flat Earth theory. You’re so stupid Frank, you don’t understand the most basic and simple things.
Pingback: Meaningful Conjunctions | Climate of Sophistry