
In hopefully my last reply to Roy Spencer, I discuss that existence is a real-time phenomenon in which instantaneous real-time impulses are driving the physics and physical reactions of reality. The averaging of impulses into time and space in which those do not occur are only abstractions, and in fact they are physically impossible and physically non-existent abstractions.

I’ll have a go at this myself, but I wanted to post it here, so that you might have a look at it too. Start at the comment link at WUWT that I now post here:
You will see a response by me, and then a long response by the commentator, which I need to think about before attempting to respond.
That Ed Bo is a disgusting troll psychopath who is banned from here. 100% sophistry.
Your first response is 100% correct.
EVEN WITH the oven cycling on and off…what Roy and Ed Bo advocate is averaging THAT process into time and space it never occurs. FFS. Yes, the oven cycles on and off maintaining a certain high temperature requiring the power in takes in real time cycling on and off to do that. Now, take that, and average it over an additional “cooking time” in which the oven was never on, diluting down to a temperature which couldn’t do the cooking.
He is one SICK lying ****. His comment is perfect sophistry.
Good on you, Joe. Keep up the good work.
Oh dear, so here we have proof-positive that what Spencer describes is “the starting point for all climate science” – thus declaring that climate science is pseudo-science! He also does not grasp that his analogy had nothing at all to do with the sun and the earth! There is no point to explain this to him, he is too limited with his intelligence to grasp the true basics of physics and thermodynamics. Thanks Joe for your patience in trying to teach the basics to an academic.
Thanks Barrie!
I just LOOOOOOOOOOOVE the turkey analogy !!! Real physics in real time !!!
What a bunch of morons !!!
That is what they are indeed…
I replied to Bo over at WUWT, but (at this posting) the comment has not yet cleared moderation, so not showing up yet. I’ll give it a few minutes, and if it appears, then I’ll post here.
As I conceded to Bo, even though I do not accept that the air of Earth is like the insulated air in an oven or that the sun blinks on and off, I DO believe that there are lots of turkeys living on Earth cooking up greenhouse-theory mythology.
Still haven’t watched the video but Robert said “You will see a response by me, and then a long response by the commentator, which I need to think about before attempting to respond.”
Ed Bo is an expert of distraction whenever he is challenged.
All you need to consider is an object heated in a 180°C oven receives a total energy input of ~2390 Watts/m2 for an hour – 2390 Watt hours per unit area.
This same object “heated” at 255 K for 10 hours receives a total energy input of ~239 Watts/m2 for an 10 hours – 2390 Watt hours per unit area.
Despite what all of these “silly climate scientists say” reality says I know which will actually cook.
Exactly.
In Chemistry we call it Activation Energy.
You need to have enaough energt to overcome the transition state. Not hot enough, no reaction.
Here’s my reply to Ed Bo:
Rosco did a better scientific job than me in his comment following mine there.
Spreading energy is so wrong. Try getting a sun tan at night, or dusk compared to midday??. Get burnt quick laying on beach, esp if fall asleep. Not so bad if rotating like a rotisserie cooked chook.
Intensity versus requency is critical. UV very intense. IR not so much. Plenty on this by ed berry, rclark, pjparson2015, harrytodd, so forth. The list goes on.
This is an example.. http://ozonedepletiontheory.info/ozone-distribution.html
Sad to see so much focus on CO2 as a mitigation lever on climate change.
Erlhapp understands weather better than many. Reality348.wordpress.com
Great to have Jo pushing the physics.
Oops… Energy not additive tab.
http://ozonedepletiontheory.info/energy-not-additive.html
Also, https://reality348.wordpress.com for Erl,
Exactly Pierre.
The other major flaw with ALL of their supposed “thermodynamic” arguments is the principle of radiative equilibrium. This states that all exchanges of radiation involve temperature changes exclusively and this simply isn’t true !
There are countless examples including different materials have different specific heat capacities, thermal conductivity, viscosity changes as energy input increases without an increase in temperature, the photoelectric effect etc etc.
But the 2 most obvious are melting and boiling/evaporation.
Significant energy is absorbed resulting in huge changes in internal energy but no change in temperature until the process is completed.
There is no simple energy in = energy out relationship as shown beautifully by Pierre above.
Joe, you might want to pick different comparisons. The rocket must overcome gravity to achieve. The turkey doesn’t just get warm, it also undergoes chemical changes. In the climate, the fundamental atmospheric changes are state changes of water, and those can occur even below freezing temperatures. PWM is a common method of delivering stable power to motors, and they certainly perform properly. The emissions from the surface are temperature-dependent, day and night. So why not just show the spectral output of the earth as a time series, showing solar input spectrum and power, and the spectrum and power output of the earth?
The human mind is geared towards familiar comparisons. Our brains are wired for metaphors. But there’s a way to do this right and a way to do this wrong. A general audience probably does better at understanding with familiar metaphors. But, apparently, some PhD’s can’t even handle these.
Start in with technical descriptions that are really deep, and the PhD’s counter with equally complex sophistry, while the general audience and the ruling politicians are left scratching their heads, saying and doing stupid things, because they have no clue.
Exactly.
Rosco says:
2019/06/06 at 6:38 PM
Exactly, ‘Energy in’ does Not (often) equal ‘Energy out’.
I’ve never bothered to do the math of these energy conversion because I see that they are wrong in very basic ways. They’ve omitted the time element, the moments when these ‘averages’ rarely occur. As I’ve pointed out on many blogs that the idea ‘Energy in’ = ‘Energy out’ is unnatural and unrealistic. The oceans get warmer or cooler without the variable solar input? The human population has doubled 3 time since 1800 without altering energy in or out?
No it’s a nonsense idea!
Nature sequesters away solar energy; nature actively tries to prevent ‘energy in’ equalling ‘energy out’ at every moment of life. Life does the strangest thing, it takes diffuse and variable solar energy and through many processes turns it into more concentrated and stable energy that holds new chemical bonds. Sunlight, water, CO2 and a few minerals and nature can make a forest of trees that last a few hundred years, maybe a thousand years. Solar energy converted (in a real tangible sense) to chemical bonds.
I’m sure that over the entire time that the sun and the Earth are to exists, ‘Energy in’ will equal ‘Energy out’, ultimately. But right now during this time when natural life rules our world, it does not because it doesn’t need to.
Just In one single sentence a credentialed climate scientist debunks the entire climate alarm industry. Spreading direct sunlight over the entire earth all at once is “… the starting point for all climate science …”. https://ilovemycarbondioxide.com/pdf/One-sentence.pdf
This all sounds similar to the historic Geocentric theory. It was assumed the Earth was the center of the universe. Things worked out nicely under this premise, except for planetary orbits, they didn’t conform. Celestial Spheres were introduced to explain the planetary anomalies. Models were created employing these theoretically-manufactured Celestial Spheres and they functioned quite well. Once the more correct Heliocentric theory became accepted, planetary orbits were more easily explained and Celestial Spheres were not necessary, they never actually existed.
Now, the assumption that the Sun’s energy intercepted by Earth could be averaged across the entire surface area is the initial premise. Subsequent calculations haven’t conformed to reality so the forcing of Greenhouse Gases has been introduced to explain those discrepancies. Finally, we’re on the cusp of dismissing the ‘Average Sunlight on Earth’ premise and we can realize that ‘Greenhouse Gas forcing’ is not necessary nor real.
Thomas H,
At least geocentric theory acknowledged more than one-fourth of the sun, and so I think that it was a much better model than the radiative greenhouse theory. The error there is one another level of inadequacy, as I see it.
My latest reply to more Ed Bo wisdom at WUWT:
He might know very well how an oven works, but he does not know how the radiative-greenhouse-effect-heuristic depicts something entirely different from his oven analogy.
A proper oven analogy would have the oven power coming on at one fourth the power required to cook the turkey, over a span of time where this one-fourth power cycled on and off intermittently.
His description of the Earth’s rotation out of the sun’s power describes Joe’s heuristic rather well, I think. But he thinks he is talking about full-power cycles, when this is not what the diagram shows or what the math there means, as I see it.
Exactly.
Here’s another way that I think about the flaw of the flat-Earth diagram:
Imagine the sun shinning at full power on a rotating Earth. The hemispheric Earth surface area under full power immediately shuts off the sun after one second, as the Earth continues to rotate, dragging the spherical one-second moment of flux around the globe, somehow magically making it last in an ever diluting spherical sheet (even in the dark), until it as thin as one-fourth its full power, now covering the entire Earth surface area at once, with no loss at any stage of rotation.
How magical is THAT ?
This is the starting point of all climate science? Magic is the starting point of all climate science?
Related picture coming up shortly (I have to make it first) … (^_^)
Thank you Robert Kernodle for your response above.
If I were doing calculations of how much force my bicycle tire uses to propel me up a hill, do I first determine how much force there would be at some point in time and then average it around the entire circumference of the tire? When I do that, the vectors all cancel each other out and I don’t get anywhere.
I think we can use their own methods to showcase how absurd it is to take the Sun’s energy intercepted by Earth at some point in time and average it around the Earth based on surface area. The first claim is that since a hemisphere has twice the area of a circular plane of the same radius, then we need to divide the Sun’s energy by two. (They subsequently divide by another two to average in the other hemisphere.) Based on this, we can control the dilution of the Sun’s energy impacting the Earth by altering the surface layer itself to have more area. Their claim is that more surface area dilutes the Sun’s energy. We just need to alter Earth’s surface to have more surface area. Paved parking lots can be grooved, Areas of ice can be ‘pebbled’ as if it were to be used for curling. Deserts, highway medians, roofs can be altered in shape, cars can be dimpled, etc. Imagine the Earth receiving only 80% of the energy it receives now. These changes would have an immediate impact, and that’s in sharp contrast to the claims of curbing emissions. Of course this is all absurd, since the Earth would continue to receive the same amount of energy from the Sun.
Crap!
Now tom0mason’s comment has got me questioning the whole energy-in-energy-out premise too.
Energy makes the chemical bonds that create the molecules of life, right? So how does THAT energy get out, without killing all life? — Is that a stupid question?
@ Thomas Homer 2019/06/07 at 7:08 AM
Nice comment there. You might like this short paper I wrote back in 2011!
principia-scientific.org/publications/Copernicus_Meets_the_Greenhouse_Effect.pdf
I should do a video where I simply narrate this paper.
Great graphic Robert! 🙂
On the graphic, I figure that by averaging the muscular force of my fingers depressing keys to get my photo-editor to respond — you know, counting the times I paused between various efforts to judge what I had done —- averaging my total muscular force-applied over the entire time of creation, then spreading this force equally over my entire keyboard and mouse (even on keys that I never touched), that I did not actually produce this graphic by myself, since I needed a green-hand effect to make my fingers 33% stronger than they otherwise would have been.
Brilliant.
Joseph: Wow, 8 years ago you nailed the crux of the issue (I’ve forgotten how long ago I found your site, not sure I saw the article before)
“The model equates the energy flux density of the incoming power, to that of the outgoing power. This is not a requirement of the Law of Conservation of Energy (LCE).The LCE pertains to total energy, i.e., the total number of Joules only, but not to the flux density of those Joules of energy.”
I’m not sure if this chart will display as an image, but for me, it describes the boundaries for temperatures on Earth.
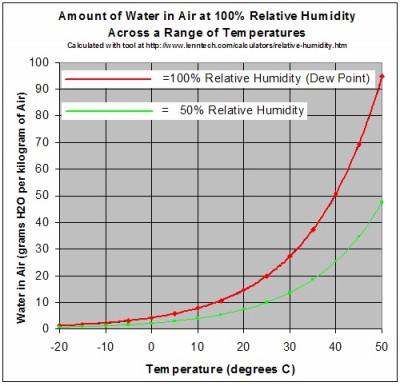
Climate scientists assert that when there are 30 grams of H2O per kilogram of air at 30°C in Thomas’s graph above you feel hot because these powerful greenhouse gases are radiating “huge” amounts of energy at you. I wonder what effect the ~650 milligrams of CO2 in that kilogram contribute ?
I say you feel hot because your body has lost its primary cooling method of evaporation at your skin surfaces and chooses in a vain attempt to remedy that by simply trying harder by producing even more sweat.
The idea that the absorbing “disk” hypothesis is incorrect and that a hemisphere is right leading to a factor of 2 not 4 is false ! We need to stop talking about this as if it means anything at all.
The important fact is the radiation flux NORMAL to the plane on each square metre of Earth’s surface considered. For the total area of a disk this is PI x R2 x S(1 – A).
But a hemisphere is different as the flux NORMAL to the plane on each square metre of Earth’s surface varies as the cosine of the angle subtended from the centre of the Earth to the point on the surface under consideration – the latitude in North-South terms and longitude in day length terms.
So we stop the earth and calculate the energy flux over the hemisphere with the Sun over the equator.
If you say S = 1361 W/m2 then S(1-A) = ~953 W/m2 and when the Sun is over the equator this is the flux NORMAL to the surface there.
Move to 45° N or S and the flux NORMAL to the surface becomes Cos 45 x S(1-A) = ~674.
At the pole the flux NORMAL to the surface becomes Cos 90 x S(1-A) = 0.
The same principle apples for sunrise to sunset. Before sunrise the flux NORMAL to the surface is 0, at noon a maximum and 0 after sunset.
Integral calculus is required to find the average flux is the same as if one simply considered the disk uniformly irradiated in the first place.
So don’t think the hemisphere illuminated changes the four factor to two because it is irrelevant and it doesn’t !
What matters is the sum of the point fluxes normal to the plane of the surface at the point considered and these add up to the same as if one just assumed the disk area uniformly irradiated.
Stop talking about a factor of 2 – it is wrong !
Joseph.
This “Rudolph Patterson” fellow is quite plugged into himself. He’s writing a mini novel on your posts. My favorite line of pious condensation is this one, ” I enjoy this awkward moment, when I get ot explain thermodynamics to an Astrophysicist. Thanks for the opportunity.” So smug like a climate clown in a rug.
Haha…seriously. Was thinking of doing a vid on his insane comment.
So, where do we find this Rudolph Patterson’s brilliant work? Where is he writing his wisdom?
https://www.youtube.com/attribution_link?a=wIpdAR-WSIWCvCW-&u=/watch?v=3Y9wV4cciXA&lc=z22iszeavmjki1bqd04t1aokgwo2mjhvspvrlhx2yexurk0h00410&feature=em-comments
RK
“Spreading Solar Energy Over Whole Earth is Pseudoscience” Can’t miss it it’s in 3 exhaustive installments.
RK,
Not sure what happened I will repeat: “Spreading Solar Energy Over Whole Earth is Pseudoscience” Can’t miss it it’s in 3 exhaustive installments.
I’ve now muted him from the channel so the comments might be gone now…but I did save them on disk in case I want to make a vid about it sometime.
JP et al
While your point is well made and irrefutable to anyone with an ounce of integrity, you are getting caught up in the weeds. I would prefer if you attack the actual fake physics of the imaginary greenhouse effect, rather than debating the starting point of the greenhouse fallacy.
It is claimed that the incoming SWR and upwelling LWR and subsequent downwelling LWR are measured and accounted for in real time, with actual scientific instruments.
Of course the actual measured upwelling LWR is a much smaller number than that which is derived, and there is a tremendous amount of complex and incorrect application of the SB constant, in order to turn a small amount of upwelling LWR into a large amount of downwelling LWR.
In short, what I am saying is that the instrumentation used to measure the LWR is essentially a “black box”, which incorrectly applies the SB constant to all measurements, to derive an outcome.
The simple proof is that there is no room for an variable input of emissivity in the calculations. A debatable 68% emissivity rate for Earth would reduce the calculations by 1/3.
The pyrometer manufacturers have an equally sweet deal to the climate alarmist researchers. They guarantee the “calibration” of their instruments, which of non-falsifiable. There are numerous variable inputs, which allow for a wide array of results, before the misapplication of the SB constant, to get a derived result that is satisfactory to the climate alarmists.
IMO, this is the key to falsifying the fraudulent earth energy budgets, which are worshipped by all members of the climate cult.
I also have a different opinion concerning what the basic, core fallacy of climate science, is actually composed of. I believe that the SB constant has no place in atmospheric science, whatsoever. You simply cannot apply a formula derived for solid, black bodies, in a vacuum, to a dynamic, gaseous atmosphere, without simply making up many of the inputs with WAGs.
Therefore, I conclude that virtually 100% of published climate science, which refers to the SB constant, or any referenced paper which relies on same, is simply junk science. There is no way to sugarcoat that assertion.
I make the same conclusion entirely 100%, but in my opinion, debating the minutia has *always* been a losing battle as fine technical details can be debated infinitely, and, few people are equipped to understand them, and, many people who think that they do, do not.
The fake physics of the imaginary greenhouse effect has an origin in their “flat Earth” spreading of sunshine over the entire planet. How the SB constant and equation is used after that may or may not be correct, but is no longer relevant because the founding error occurs before that usage.
The imaginary greenhouse effect is invented *for* the divide-by-four paradigm of equivalency to flat Earth theory. And then of course everything in climate science is interpreted through that, whether the SB law or any other minutia. There is no climate science greenhouse effect, because this was invented to satisfy flat Earth theory with freezing cold sunshine. Hence, the basis of climate alarmism and all subsequent interpretations are invalid, and, modern science allowed flat Earth theory through its system to the most important contribution modern science has ever *thought* that it made to humanity.
Joseph, it is funny that we both arrive at exactly the same destination, through entirely different means. Heaven forbid we should reach consensus!
Rosco said, “The idea that the absorbing “disk” hypothesis is incorrect and that a hemisphere is right leading to a factor of 2 not 4 is false ! We need to stop talking about this as if it means anything at all.”
Yeah, I think I fell for this, in passing, over at WUWT. What was I thinking? Wrong — yes, it’s not a factor of two — it’s all of it, right? — the hemisphere is the surface area for that whole, undivided flux, which decreases as a function of the cosine, moving North or South, and it is calculus that allows us to calculate this summation as the whole disc FOR THE HEMISPHERE.
I concur with Dan and Joe. With Joe, because I think it is important to show what a cartoon is being used to teach beginners at major universities. With Dan, because he gets into the validity of the actual instrumentation used to measure the physical phenomenon, and how things there are not as they are depicted, with the greenhouse-mometers [I mean, pyro-watcha-mathingies] and misuse of SB. I think Rosco is on board with this too, if I’m not mistaken.
Dare we now start in on the fundamental flaws of a particle paradigm that can view light as little packets amidst a reality that we also have to confuse ourselves into believing contradicts this with waves, when it really doesn’t?
Nah, baby steps.
Can I ask why Dan thinks the SB constant only applies in a vacuum ?
“I believe that the SB constant has no place in atmospheric science, whatsoever. You simply cannot apply a formula derived for solid, black bodies, in a vacuum, to a dynamic, gaseous atmosphere, without simply making up many of the inputs with WAGs.”
I certainly agree that the SB relationship derived from the cavity oven experiments in the 19th century probably do not apply to any gases but as far as I am aware these experiments were not conducted in a vacuum. Even if they were conducted in a vacuum there would still have be radiative flux passing through it determined by the temperature of the environment housing the vacuum chamber.
The cavity was designed so that any exterior flux entering through the small opening was likely to be completely absorbed and never escape. Without this arrangement it would never be possible to derive equations describing the emissions because of the uncertainty of the ambient radiation.
The reason I believe the SB equation is not applicable to gases is there is a very specific relationship between the blackbody emissions and the 2 equations describing these.
The Stefan-Boltzmann equation can be derived from Planck’s equation by integrating over the variable chosen – frequency, wavelength etc. This serves to verify the authenticity of both. Incidentally Wien’s displacement law can be derived by differentiating Planck’s equation, setting the resulting expression to zero and this arriving at the expression for finding peak emissions.
The total emission – P =sigmaT^4 is also equal to the integral of Planck’s equation times PI. This relationship was fundamental to deriving modern values for sigma.
Thus the area under a Planck curve times PI is exactly equal to sigmaT^4 !
As gases do not ever emit a blackbody radiation spectrum or anything even approaching it it is highly unlikely they obey the Stefan-Boltzmann law !
This example from “The Little Heat Engine: Heat Transfer in Solids, Liquids and Gases” by Pierre-Marie Robitaille ( I recommend reading this if the subject appeals)
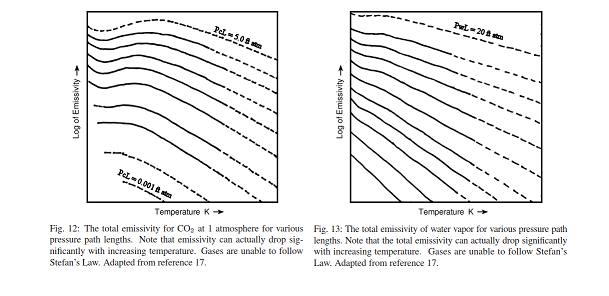
shows how the Stefan-Boltzmann law fails for both CO2 and Water Vapour as temperature increases. The emissivity decreases as temperature increases !
Wikipedia describes the pyrgeometer thus:-
“The atmosphere and the pyrgeometer (in effect its sensor surface) exchange long wave IR radiation. This results in a net radiation balance according to:
Enet = Ein – Eout
Where:
Enet – net radiation at sensor surface [W/m²]
Ein – Long-wave radiation received from the atmosphere [W/m²]
Eout – Long-wave radiation emitted by the sensor surface [W/m²]
The pyrgeometer’s thermopile detects the net radiation balance between the incoming and outgoing long wave radiation flux and converts it to a voltage according to the equation below …”
Already this sounds like pseudoscience to me because this “measures” “NET” radiation ??
What it actually does is “infer” a value based on a whole host of courageous assumptions – I use the word “courageous” in its UK political context where only a member of Parliament prepared to lose their job makes a courageous assumption !
As far as I can see “net” radiation is displayed in this image :-
P(net) is the shaded area in the graph – the difference sigma(303)^4 – sigma(254)^4.
It is impossible to define this quantity without explicitly knowing both temperatures in advance –
Already this sounds like pseudoscience to me because this “measures” “NET” radiation ??
I have prodded contributers at WUWT who make the ‘divide by 4 to get an average’ claim to defend their theory against the statement that “half the Earth intercepts the Sun’s energy that is missing from the Earths shadow”, and I’ve steered them towards saying they need to divide by two when averaging two hemispheres. I know that this still would not provide a meaningful metric.
Now I’m realizing the ‘divide by 4′ theory is not even wrong. The first claim to distribute the theoretical energy of the flat disk Earth across one hemisphere is to divide by 2 since the half dome has twice as much surface area. However, consider the half dome with circles of circumference drawn at each degree from the outer edges towards the peak. The length of the outer circles is much greater than the inner circles’ length near the peak. Their claim is that the Earth is intercepting less of the Sun’s energy in the outer circles than the inner circles, but there is much more length of the outer circles. Their own theory demands that this become a weighted average, it’s not a simple geometric surface area average. By their own theory, they have been greatly overestimating amount of Sun’s energy intercepted by Earth.
Joe,
I find you expalnations both simple and totally in line with the physics I learnt at school and University. I am also flabergasted that so called “climate scientists” can create a “model” which you correctly point out bears no reality to what is actaully happening in real time and then invent the greenhouse effect to compensate for the inadequacies of the initial model. I almost fell off my chair laughing when I read the “steel greenhouse” argument about putting immaginary shells around the a black body and the core temperature getting ever hotter. I belive that at the age of 13-14 I would have had sufficient high school physics to disprove that pseudo scientific mumbo jumbo. What beggers belief is that people can somehow belive this is true. Maybe as you point out they only conceptualise things and hunt for the answer they want to prove…with no maths or derivations…just a reasoned head exercise (as per the original steel greenhouse argument). Well all I can say is I am as dumfounded as you that climatologists still cannot see what you explain: True real time real events that actaually happen versuus a totally fictitious model system that requires fake science to cover up the inadequacies of the model.
@Rosco
I am in no way trying to refute the SB constant or it’s general acceptance in science. To be clear, the SB constant = a black body with 100% absorption and emissivity, in a vacuum, at 0 degrees kelvin. I did not chose that it should be a vacuum. It is an elemental starting point for the SB constant, that it is derived from a vacuum. IE the “perfect” state, which AFAIK does not exist anywhere in the universe.
I did mean to imply that the sb constant only applies in a vacuum, as it would be entirely useless in earth sciences, if it was so. I was however, unequivocally stating that the SB constant has no place in atmospheric science.
Correction: I DID NOT mean to imply that the SB constant only applies in a vacuum.
Maybe they need to remind themselves what the lapse rate means.
https://en.wikipedia.org/wiki/Lapse_rate
Thanks a lot for fantastic and funny rebuttal of Spencer. I wish you could elaborate further on this paper of yours with a short summary in a video: A Discussion on the Absence of a Measurable Greenhouse Effect.
(Your videos could have been shorter though. You don’t have to repeat yourself that much,)
If you already get it, then the repetition can seem like a lot, but if you don’t, then the repetition works well. Think of someone who does not get it yet. Again, I’m not bothered by the repetition — it adds a real-life interactive feel.
I think that a problem today with people not performing well, is that people trying to teach have forgotten how to teach or do not know how to teach. Teaching involves repetition — telling people what you are going to tell them, telling them, and then telling them what you told them.
Now Spencer has put up a post, and WUWT has re-posted it — a post about the solar flux at different latitudes, claiming that a model of this shows that the respective latitudinal solar flux does not account for the latitudinal temperature, unless you also figure in a greenhouse effect, … if I understand correctly.
He’s using a spreadsheet for that model, and it doesn’t include the effect of a lapse rate and gravity. As if a spreadsheet can model the climate…morons! 100% incomplete model…but why would that matter to them when they literally don’t understand what’s wrong with their flat Earth model in the first place. He should be mocked and ridiculed for this attempt…as if he’s modeling anything to do with the climate on a freaking Excell spreadsheet. Or even if it’s with a real PDE in a numerical script…his model has no latent heat from H2O, for example. Smart enough to not realize how dumb this is.
The binary distinction I discuss in the vids comes BEFORE anyone makes incomplete models. Because the model is incomplete, then its necessary deviations from reality are called the GHE! lol
Real greenhouses empirically demonstrate no climate RGHE. Therefore deviations from models require another explanation. Gravity and the lapse rate would help, as well as thermal energy retention in latent heat and the atmosphere.
This is from some published source but its called something like the latitudinal energy balance:
rad_balance_erbe_1987-b7253690072842119413.png
The excess of input around the equator as compared to the temperatures at the equator is balanced vice versa at higher latitude.
Here it is:
Thanks Joe. Alan Siddons worked on this issue earlier last year:
Click to access Does_Surface_Area_determine_Temperature.pdf
Already since 2008 he also repeatedly came across what you’re still dealing with right now:
Click to access Stupidity.pdf
Hans S,
In reading Alan Siddons analysis, I am experiencing some dissonance with his statement that,
“Given that a sphere has four times the area, however, it follows that a hemisphere has two
times, and should therefore absorb half as much energy as a flat surface.”
If the intercept disc that receives the full flux is on the hemisphere side, then I thought that the hemisphere is exposed to this ENTIRE amount of flux, thus “absorbing” (during rotation) this ENTIRE amount of flux figured for the intercept disc, NOT just half, figured from the false division by four. Of course the flux at each latitudinal difference is less than the full value for the disc/hemisphere, but I thought that the effect was the WHOLE flux figured for the intercept disc.
If the division by four is false, then why use half of that to say that the hemisphere now receives half of a false flux dilution, as a set up for a premise to disprove? I’m confused. It seems like Alan is accepting the approach of the division by four, so that he can orchestrate his own intricate reworking of that falsehood from a different perspective to get a slightly different figure that merely changes the 33-degree claim to less.
In short, I am not convinced that Alan’s analysis is correct.
Insights, anyone?
Some discussion around differences between absorption and emission may be helpful too. Sun hitting surface ~168W/m2 is ~ -40C. Emission ~240W/m2 is ~ -18C. Yes? So, if surface temperature is about 15C, is the so called Ghg effect 55C or 33C?
Remember direct sun at TOA. ~ 1368W/m2 is ~ +121C. Some theories posted (elsewhere, not Here) just don’t add up.
I continued making comments here:
http://www.drroyspencer.com/2019/06/on-the-flat-earth-rants-of-joe-postma/
Some may find them interesting.
Cheers Zoe that’s excellent.
Also, just some basic questions:
Isn’t flux a RATE of energy flow per second?
Isn’t what heats the Earth ENERGY?
To figure energy, wouldn’t we need to multiply flux at each latitude times some area for some duration of time to figure out the energy? And wouldn’t this be a pretty advanced calculus calculation? Has anybody done this? Is there a proven simplification to arrive at a correct answer?
Here’s the problem I’m seeing:
You’ve got a rotating Earth-sphere, where the flux impinges at infinite-degree increments of latitude on the illuminated hemisphere, for infinite different time intervals associated with the infinite-degree latitudinal increments. Somehow you’ve got to integrate this, to figure the energy coming in for (I’m guessing) half an Earth rotation around its axis — the time it takes for the hemisphere to move through the various flux angles, accumulating the respective latitudinal energies.
Now this energy is driving all sorts of processes that determine various temperature zones, for which we first have to figure out what a “temperature zone” means.
It’s all seeming not so clear anymore.
Any average flux, as I see it, no matter how it is calculated, is never the flux acting at the given latitude for the given time, to cause the physical effects of this particular amount and duration of flux at the particular latitude.
And then there’s the question of how these many latitudinal fluxes collectively act as a whole to cause the various circulation patterns, and evaporation, rain, clouds, etc.
The phrase, ” non-linear, coupled, chaotic system”, comes to mind, as well as the statement by the IPCC in one of it’s earlier reports, admitting, in one sentence, that climate forecasting was not possible for such systems.
Exactly.
It seems that the surface-area-energy-in-energy-out approach tells us little about the actual physical light/Earth interaction that causes the actual physics that produces the climate.
I’m having talk with a fellow who is not belligerent but believes CO2 could be a problem. Anyway he’s a little twisty as they all are so here’s the latest post which led me a little confused. I need some clarification before I reply:
“You wrote: “The atmosphere of planet earth has work done it by the force = gravity” No, gravity does not provide work, because it is constant. If gravity changed (locally), then it would be work. Otherwise we could use gravity to set up a perpetual motion machine. Two asteroids orbiting each other in space in equilibrium would produce no energy from their mutual attraction. Same with pressure. If pressure changes you get work. If the pressure is constant (as it is globally averaged over the Earth), then no work is done. You wrote: “The Greenhouse Effect can’t calculate the amount of solar radiation energy needed to prove its validity” I don’t understand what you mean by this. The solar constant is well known, and its incidence on a sphere (the Earth) is one quarter its total value. That’s very straightforward. No need to invent anything. On the laws of thermodynamics – I thought we had agreement there. Yes, a change in temperature of a cooler object can effect the temperature of a warmer object, by slowing its rate of heat loss. Have you never had a car that was more likely to overheat on a hot day than a cold one? Even though the ambient air temperature on both days is much less than the car engine? The reason the engine is more prone to overheat on a hot day is that the rate of heat loss from the engine is reduced when the ambient air temperature is warmer. Notice – I am not saying that the air heats the engine. The semantics would be (in terms of classical thermo) incorrect. But while heat does not flow from hot to cold, cold can moderate the heat flow of hot. Which is how blankets and clothes work. They don’t provide any heat – they slow heat loss. Let me quote the man who wrote the 2nd Law of Thermodynamics: “What further regards heat radiation as happening in the usual manner, it is known that not only the warm body radiates heat to the cold one but that the cold body radiates to the warm one as well, however the total result of this simultaneous double heat exchange is, as can be viewed as evidence based on experience, that the cold body always experiences an increase in heat at the expense of the warmer one.” That’s Rudolf Clausius expounding on the 2nd Law in 1887. Classic thermo deals in NET exchange, it does not touch on discrete exchange. 150 years ago, Clausius, who wrote the second law, understood that energy flowed both ways, and that the NET result was that heat flowed from hot to cold. The 2nd Law is not broken when we observe that the atmosphere radiates energy in all directions, and that this energy is absorbed and re-emitted throughout the atmosphere, and also by the ground. When the radiative energy is absorbed, that energy is added to the absorbing property, which then re-emits it. This is back-radiation. It’s a very real phenomenon.
“Robert Kernodle says:
2019/06/08 at 5:52 PM
In short, I am not convinced that Alan’s analysis is correct.
Insights, anyone?”
I stand in awe of Alan’s analysis – I had never considered this and simply took the disk hypothesis as mathematically correct and geometrically it is.
But the radiance normal to the plane at all points over a hemisphere varies with the sine if you arrange the plane and angles as Alan does using the protractor of his model.
I prefer to use the whole model rotated through 90° and apply zero in the middle as shown in this diagram from “Earth’s Climate Engine” which I recommend reading to all who haven’t:-
Thus you can talk about points on Earth’s surface as latitude for north and south and longitude for east and west.
At 30° North the intensity of the solar radiance normal to the tangent (plane) at that point is cos 30° or about 0.866 times the solar constant. 1368 x 0.866 = ~1184 W/m2 and adjusted for 30% albedo = ~829 W/m2.
The area that a unit beam width is spread over is 1 over the sine of 30 = 1/0.5 = 2 units.
Accordingly I think I totally agree with his analysis that a hemisphere does indeed have an average radiance factor of 2/pi and “spreading” that over two hemispheres results in a factor of 1/pi = ~0.32 and not 0.25 thus exposing yet another fundamental flaw in climate science.
Rosco,
Am I correct in seeing that Allen is giving light beams a width that increases a light beam’s spread incident at a certain angle? If so, then what justifies giving a beam of light any spread at all, just because we are considering its incidence on a particular angle? I thought the light was all one massive beam that got affected only by the angle of incidence, not by the assigned width of a beam at a particular angle.
“Alan”, not “Allen”. Sorry.
The input area is 5, the output area is 46.
According to GHE religion, the result should be a slightly purplish blue.
In reality it’s all red. Case closed.
Good one.
Robert Kernodle says:
2019/06/09 at 6:32 PM
“Rosco,
Am I correct in seeing that Allen is giving light beams a width that increases a light beam’s spread incident at a certain angle? …”
Only for demonstration of the mathematics of the concept. The goal is to determine whether the average radiance over the sphere is based simply on the area consideration – 2 times the area of a disk and therefore 0.5 the intensity normal to the disk – or not.
He chose a width of 6 to show how this beam intercepted different arc lengths at different points of the protractor. You can see this easily rather than having to imagine something abstract. He then showed how with just a few values the average was already tending to 0.6..something and the more angles you choose the better the accuracy of the average.
In the limit as the “width of each beam” approaches zero, which occurs as you increase the number of angles to very very large numbers the radiance value will approach the limiting value of 2/pi over the hemisphere and each beam “width” is effectively a point with no real dimension. This concept is the basis of much of basic calculus. I used this concept in confirming the area under the Planck curves I plot agrees with sigmaT^4.
This shows very clearly to my mind that climate “science” is completely wrong even if their use of averages was right because they’ve got the wrong factor of 0.25.
The proportion of plane parallel radiation absorbed over a hemisphere is 0.6366 and not the 0.5 assumed by area considerations alone. Then using the “spreading” of this over a whole sphere the value for the whole sphere is 0.318 and this is significantly larger than the 0.25 used in all of the calculations of climate “science” thus meaning all their results are seriously over estimated.
It would be nice if you guys could get together and talk science like adults and work out your scientific disagreements in the pursuit of scientific integrity over personal ego. However I think the odds of that happening are less than two asteroids colliding in space and creating a wormhole to Santa’s Workshop…
Not understanding your comment, CM. Who’s being a child here?
Rosco,
There’s still something troubling in Alan’s analysis, but I can’t quite put my finger on it.
The links to Alan Siddons two pdf files are very interesting and informative. I can’t see where he is in error. The math is solid and it’s another nail in the AGW coffin. Robert, I don’t see anything troubling with the analysis but you may be thinking deeper about it than I am.
CM, who is being childish?
Rosco and George,
Alan’s math does seem to follow, but there’s just something bothering me about it — maybe my own dissonance of not quite getting it — I don’t know, but I’m obsessing on resolving this dissonance one way or another. Not there yet.
I’ve really been quite in tune with everything that I have ever read by Alan, but this has just got me in a quandary, for some reason.
The solar flux at Earth’s distance is figured for the interior of a large sphere that is the radius of Earth’s orbit. The traditional intercept disc for Earth, … for figuring the solar constant is the disc with Earth’s radius. This disc with solar-flux vectors seems to be mapped onto a hemisphere, but I’m wondering whether even this has bee right.
If we unfolded a hemisphere of Earth to the size of a disc with a radius of the arc length of a meridian, then this disc would have a larger surface area, but why might we use this disc instead of the intercept disc with radius of Earth’s radius? There seem to be two spheres that we are trying to reconcile — the big one surrounding the sun, for which the flux is calculated, and the Earth sphere interjected into this. Can we even properly say that this flux applies to the surface area of a sphere for which it was never exactly calculated? and how would one do this calculation exactly … for a sphere (Earth sphere) intruding into the solar sphere, whose interior surface area is the actual basis for calculating flux?
Like Robert K has said above, there has been something that I can’t reconcile with the divide-by-2 to average the Sun’s energy impacting the imaginary disk perpendicular to Earth’s shadow, to half the Earth (hemisphere). Alan Siddons’ article referenced above is right on topic.
Of course we know there is twice as much surface area with a hemisphere compared to a flat disk of the same radius. However, a straight/linear averaging gives results like this:
[
sine(0) = 0
sine(90) = 1
–> therefore, the average sine value over the range 0 thru 90 is .5
]
That is wrong.
The ‘average’ sine value is more like 6.3, and since the area of segments of a hemisphere is a function of sine, it’s applicable here:
__________________________________________________________________
Thus the area north of a line of latitude is
A = 2*pi*R^2(1-sin(lat))
The area between two lines of latitude is the difference between the
area north of one latitude and the area north of the other latitude:
A = |2*pi*R^2(1-sin(lat2)) – 2*pi*R^2(1-sin(lat1))|
= 2*pi*R^2 |sin(lat1) – sin(lat2)|
____________________________________________________________________
But there is more to this ‘averaging’ issue since the very outer edges of the earth that are in daylight are still receiving more than zero energy from the sun. So even a straight linear average shouldn’t just be ((Max Sun’s energy flux of imaginary disk) + zero)/2, since any area in daylight is still being impacted by some amount of the sun’s energy.
Reblogged this on Climate- Science.
Here’s an illustration of my confusion:
Would using an intercept disc of radius (pi r)/2, rather than an intercept disc of r, approach the same reasoning as Alan’s? If so, then I could picture this better and maybe resolve the dissonance.
The ratio of the radius “r” to radius “(pi r)/2” is:
r / [(pi r)/2] = r / (3.14159r/2) = r / 1.57r = 1 / 1.57 = 0.6369
… and I’m seeing that this is near one of Alan’s figures of 0.6366
Actually, now I am simply looking at the ratio of 2r to pi r, which is
2r /3.14159r = 2/3.14149 = 0.6366, which is exactly Alan’s figure.
Climate science has been using an intercept disc of the wrong radius ???
3.141 5 9 (FIVE, not four).
Grrrrrrrrrrrrrrrr !
Gentlemen and ladies,
I was referring to the general war against climate change hysteria. Climate Clowns win because they are well funded, organized and no large single entity is fighting against them. It would be nice if all of those opposed to climate change would agree they are on the same side. We all know where Joseph stands but some of the others are…questionable (and no if you are a regular here that’s not you). Very few have been brave enough to stand up because they can lose their jobs and careers as well as reputations. In this regard, I applaud Joseph for doing what few are brave enough to do.
This cause needs a few more Josephs and a magnanimous personalty to lead the front against climate change (like Trump for instance) someone who can control egos and get people working together for a common good: To fight against climate change hysteria. In order to do that people like Joseph and Spencer will have to work together…that I reckoned as likely as two asteroids colliding and opening a wormhole to Santa’s workshop.
Then again weird things can happen. If someone like Trump can stifle some of these egos maybe we can get a united front and be on the offensive for a change instead of always on the defensive.
If a strong force opposed to climate change I bet quite a few scientists from the IPCC would join the revolution and testify.
Spencer and Postma ? — that’s about as realistic as wind and solar providing the necessary power for civilized comfort as we have known it. (^_^)
Oh well, one can dream, I suppose.
I suspect that the IPCC folks are way too comfortable in their habits to risk upsetting that comfort, even remotely. To paraphrase that organization’s lingo, “It is very likely (high confidence) that IPCC folks will continue on the path that they have been on on indefinitely.” What it will take is a force that will make more people laugh at them. Some news-reporting agencies with integrity would help.
I’m interested in absolute final truth, and what they’re doing is a lie. It has been demonstrated that they will not reconcile over towards rejecting obvious pseudoscience at the level of flat earth theory, hence: the object is not now to reconcile, but to destroy. The coming grand solar minimum will help, and this material needs to be out there once the masses realize they’ve been had while they’re starving and freezing and come looking for a reason why their future state wasn’t predicted.
Robert and anyone else confused about Alan’s analysis I cobbled together a little spreadsheet which has angles from 0 to 180 for sine and from -90 to +90 for cosine.
It has 3601 angle values using 0.005° increments, takes the sine or cosine of each of these and then averages the sum. It gives 0.636442942260258 as the result. Using more data points will take it closer to 2/pi but it is pretty damn close.
This is the link https://www.dropbox.com/s/l7q6fkliqu2h4w1/Sin%20and%20Cos.ods?dl=0
As is shown here the cosine of the angle the solar radiation impinges Earth’s sphere gives the intensity normal to that point.
Thus the spreadsheet calculates the intensity of the solar radiation at every point of the irradiated hemisphere, adds the values up and calculates the average.
This is indisputably correct while the area factor involving a uniformly irradiated disk is wrong !
Joseph,
Never underestimate these people I’ve seriously considered why they are hung up on chemtrails is to have an excuse saying we cooled the Earth too much using chemtrails w/o people knowing it and now it’s too cold. We need more taxes to fix the problem. A liar will lie until death even caught red handed yes I agree destroying them is the only real way to stop them. Voting their counterparts out of office would be a good start. You can’t shame them they have no conscious to shame you have to find a way to shut them up.
Robert,
You are right I doubt Spencer would ever admit he “may” be wrong even if it dawned on him he might be.I certainly doubt he would accept being wrong if someone else is going to take the credit of being right.
To anyone here,
If you think I was making fun of you I was not. You’re good folk don’t stress it.
To anyone else,
This guy I’m talking too is way out of my league but I’m trying to keep to simple facts but he distorts everything. Such as saying he does not believe atmospheric pressure dictates temperature.
I said, “…gravity is the reason why the surface temperature is what it is. No matter how you want to dice it gravity is the reason. No gravity no atmosphere so either indirectly or directly gravity and atmospheric pressure controls temperature. Without gravity delayed heat or latent heat would not exist as far as I am concerned.”
Now obviously we were talking about radiant heat (off of the surface) not the direct solar surface temperature.
He twisted it to this,
“Gravity does no work if it is constant. Work is only done if gravity changes locally. Same with pressure. A constant pressure does no work, which is why a full scuba tank is the same temperature as the ambient air. But when the tank is being PRESSURISED, then the temperature changes, because then work is being performed. Did you know that the pressure of a full scuba tank is a bit more than the air pressure at the surface of Venus, which is more than 400C? So, if the amount of pressure alone were responsible for temps, then a scuba tank should definitely be about 400C, same as the surface temp of Venus. So if you think that the amount of constant pressure is responsible for temperature, how do you explain scuba tanks being the same as room temperature?”
Just throw in convection there CM then gravity CAN do work on falling air. Also don’t forget the lapse rate is caused by gravity and thus bottom of atmosphere must be warmer than ANY expected average. Also, the RGHE should modulate the lapse rate, but, doesn’t, just as it doesn’t modulate a real greenhouse temperature beyond convection stoppage.
The reason this is right is it gives the intensity normal to every point on the hemisphere while the sphere -> hemisphere -> disk model is only an approximation – and it is WRONG.
The simple area relationship used by climate “scientists” is shown to be irrelevant – they are trying to calculate average W/m2 and they get it WRONG !
Also remember sine and cosine are related relationships.
Frankly I’m not surprised that a bunch of cocksure blowhards didn’t figure this out themselves because all they do is parrot groupthink and congratulate themselves on how clever they think they are !
That is indeed what they do…throughout the entire academic establishment.
I don’t get it?
To transform a sphere into a one-sided disc:
4*pi*r^2 = pi*R^2
The radii are different. Are they pretending they are the same?
R = sqrt(4 * r^2)
R = 2*r
1361 / 2 * (1 – 0.3) = 476.35 W/m^2 => 29.6°C
Average elevation of land = 840 m, Covering 29% of Earth
Average depth of ocean = 3700 m, Covering 71% of Earth
Average Elevation: – 2383 m (Below sea level)
Average “Surface” Temperature: 14.7 °C
Typical Environment Lapse Rate: -6.5 °C/km
14.7 + 6.5 * 2.383 = 30.18°C
29.6 °C =~ 30.18°C (Tiny error)
What did I do wrong?
– Zoe
Joseph,
Have you ever tried to contact Tony Heller? The WUWT guys don’t like him either apparently so I was just curious.
Christopher, everything is cool. I was just curious who you may have been referring to with the “childish” comment. I know it wasn’t directed at me. Good luck with the clown you are debating. That person sounds full of himself.
Robert, you are definitely looking at Alan’s work deeper than I am. LOL. Good work there!!
I’m still thinking that the more obvious way to look at the flux-divide-by-four confusion is to realize that the intercept disc used all along has been the wrong intercept disc. It should NOT be the disc that is the Earth’s shadow (Earth’s radius), but rather the disc whose diameter is the arc length of a meridian on the hemisphere.
A disc of this arc-length surface area wraps onto the hemisphere without any stretching, whereas the shadow-sized disc, when wrapped, stops short of the poles and has to be magically stretched to fully cover the hemisphere. The shadow-sized disc, thus, incorrectly dilutes the sun’s energy, whereas the arc-length-size disc does NOT dilute this energy, but “spreads it’ evenly.
The average land temperature is 9.5°C
The average “sub”-surface temperature at ~0 depth is slightly more than 9.5°C
Therefore this info from wiki shouldn’t be surprising:
“Estimates of the total heat flow from Earth’s interior to surface span a range of 43 to 49 terawatts (TW) (a terawatt is 1012 watts).[9] One recent estimate is 47 TW [1] equivalent to an average heat flux of 91.6 mW/m2, and is based on more than 38,000 measurements. The respective mean heat flows of continental and oceanic crust are 70.9 and 105.4 mW/m2.”
HEAT flux. Not energy, but HEAT flux. If there’s, on average, a positive heat flux from below to above surface, then where does that leave the stupid GH effect due to GHGs?
Up theirs, that’s where! LOL
– Zoe
(Serious question: Do we “need” the sun for thermal power? Obviously Plants &Animals need Visible Light, but just in terms of W/m^2? Seems not, right?)
* to be more clear: for there to be a heat flux from below to above surface, average subsurface-to-atmosphere energy flux would have to OVERPOWER average solar flux. And it does, just a little: 91 mW/m^2.
Great comment @Johnny
Sorry guys, I’ve been away. OK this surface area thing seems to have went insane.
First: the intercept cross-section is of course a disk.
Second: Of course it makes no sense to spread this real-time input evenly over the entire surface at once.
Third: It also doesn’t make sense to spread this real-time input evenly over the hemisphere.
The intensity of sunlight decreases with increasing surface area it falls on, i.e., the angle of incidence is an important factor too because this reduces intensity. A 1 square meter directly under the solar zenith receives perpendicular light and thus full intensity. Put that 1 square meter at an angle of 45 degrees, i.e. at a latitude of 45 degrees, and now it intercepts LESS light because its cross-section is smaller. It is smaller by cos(45) = 1/sqrt(2).
It is the same thing to say that a given 1 square meter of cross-section falls on 1 square meter of surface at the solar zenith, while a 1 square meter of cross-section will fall on sqrt(2) = 1.414 square meters of surface at a latitude of 45 degrees.
You account for this by doing an integrated average, which is what Alan Siddons and Rosco here are demonstrating. Given that intensity falls as a cosine from the zenith angle, and given the properties of the cosine function, the cosine function spends more zenith-angle above 0.5 than it does below it, and thus the *intensity projection* of the intercept-disk onto a hemisphere isn’t simply the area factor of 2, but is less than 2, thus meaning that the hemisphere is heated at a *higher* factor than simply S/2 (let alone S/4). It is more like S/1.7 for the hemisphere.
Again, I get the same figure as Alan, when I correct the actual geometry, using what I think is the correct intercept disk, as opposed to the traditional shadow disk, which is a PROJECTION of the surface area receiving solar flux, NOT the physical manifestation of the actual disk of hemispheric surface area actually receiving the full brunt of the flux.
The sun “sees” the shadow disk. But Earthlings see (i.e., feel, experience) the larger disk. The entire length of the hemisphere meridian experiences flux, NOT just the length of the hemispheric meridian that is the Earth’s diameter, which, again is only the PROJECTION, and NOT the full actual length over which a meridian receives the full brunt of the flux.
Even though I do NOT believe that the divide-by-four step is representative of anything physically real, I do believe that people trying to take this path even got THAT wrong.
A larger intercept disk, thus, is receiving more energy than represented by the traditional shadow disk. Any “average”, therefore, would be more than has traditionally been figured (I have not plugged in actual numbers to see how much more), which, even using the divide-by-four strategy, makes the “greenhouse theory” fail, I think.
The radius of what I believe to be the proper intercept disk is pi/2 longer than the radius of the Earth used in the shadow intercept disk.
pi/2 = 1.5708
The inverse of that is 0.6336, which is the fraction of total flux received by the hemisphere, which is exactly what Alan arrived at in his method, which I believe has the effect of uncovering the flux points in the infinity of the disc radius projected from the infinity of the spherical meridian length.
There’s probably a deep mathematical-analysis problem here dealing with different sizes of infinity, and how one infinity is being mistaken for another infinity, but that’s out of my league to properly discuss.
I feel ignored. Sigh.
I feel ignored. Sigh
Aw Zoe. Sorry.
The geothermal heat is negligible…measured in milliWatts. What is it: 91.6 mW/m^2 or 0.0916 W/m^2.
It is usually ignored, because if you add it into either 240 W/m^2 or 1370 W/m^2, it is still negligible.
If you have another question I will pay attention for the next 45 minutes 🙂
Joe, I was on WUWT on the day of that Roy Spencer article. This is a copy of my mini-post thread that day with its subsequent replies. Last one by me this evening.
———————————————————————————————————————
leitmotif June 5, 2019 at 3:19 am
This is the old 4 weak suns argument. Dividing the power radiated by the sun by 4 and expecting the result to make any sense.
We have a pig turning on a spit, cooking gloriously on a fire below. We divide the power radiated by the fire by 4, create 4 equal power sources of P/4 and place them around the pig (having removed the original source), stop the pig rotating and wait for the pig to cook.
How long will it take?
Dividing, subtracting, adding fluxes and equating them to temperatures is meaningless.
It’s like saying the average person has one testicle.
Reply
Mike Haseler (Scottish Sceptic) June 5, 2019 at 5:25 am
Are you ignoring the fact that much of the heat comes from hot air rising?
What is the speed at which the pig is turning?
Are you ignoring the end effects?
When you say “ready”? Do you mean all above a specified temperature, that it’s nice and roasted outside and the OUTSIDE is ready to eat? Or what is your definition?
What about cooking sauces?
Will you be basting the pig?
But most importantly, does the pig come with an atmosphere that redistributes the heat?
Reply
_Jim June 5, 2019 at 5:53 am
re: “Are you ignoring the fact that much of the heat comes from hot air rising?”
When did you last spend time in front of a roaring fire? We disposed of some old lumber in late 2017 and I can testify to the large amount of radiant (IR) heat coming off a “burn barrel” (let alone the fire itself) – it is ASTOUNDING the amount of thermal energy burning carbon-based “wood” can produce … but that’s not the point.
I think you wildly over-estimating the hot-air thing; open air pit =/= forced convection oven.
Reply
leitmotif June 5, 2019 at 6:34 am
OK, replace the fire with an overhead grill, Mike. Replace the pig with an inanimate object, if you like. My point is still the same. 4 weak suns will not be as effective as one hot sun in raising the temperature of the object.
As Roald says: Sophistry. [Roald J. Larsen]
Reply
Roy W. Spencer June 5, 2019 at 6:32 am
leitmotif: And yet, the sunlight being intercepted by the Earth (before albedo effects) does get spread over the full sphere of the Earth. That is basic geometry. Area is important. Watts **per square meter**. Averages are useful metrics, and just because the average temperature where you live is seldom ever actually measured at any give instant, doesn’t mean the average temperature isn’t a useful metric. The average temperature in Miami is very different from that in Fairbanks, and no amount of nitpicking about the average temperature value almost never actually being measured at either location will change that fact.
Reply
leitmotif June 5, 2019 at 9:44 am
Define average temperature: (max + min)/2? Something more relevant? More useful?
Average number in a telephone directory. Useful metric?
Reply
Bindidon June 5, 2019 at 12:10 pm
leitmotif
“Define average temperature: (max + min)/2? Something more relevant? More useful?”
Did you ever process ANY temperature series providing for TAVG, TMIN, TMAX?
Do you REALLY think that TAVG records all are the same as (TMIN+TMAX)/2 ?
Did you ever compare TAVG with (TMIN+TMAX)/2 where both are available?
My guess: the answer is ‘no’ for all three questions.
Reply
leitmotif June 11, 2019 at 2:27 pm
Bindidon.
My point is …. whatever?
What does an average temperature mean?
Do you use the method you like to support your argument?
Average temperatures are totally meaningless.
—————————————————————————————————————————–
Pay special attention to the reply from Roy Spencer. (muffled snigger)
Holy moly leitmotif…they really can’t understand simple things. Need a new vid on your comment!
Alan Siddons has never supported the divide by four nonsense climate “scientists” base everything on – he has written numerous articles over the years calling the greenhouse effect 19th century poppycock.
With his article referenced he has shown that the fundamental cornerstone of “climate science” is wrong because they don’t have the intelligence to even design a correct model (which is flawed pseudoscience anyway).
This is a quote from Lee R. Kump, James F Kasting, Robert G Crane. – The Earth System (Third Edition) which is the text cited by the University of Washington in their atmospheric science courses:-
“Note that it is the area of Earth projected against the Sun’s rays that enters her, not half of the surface area of Earth. (Half of Earth’s surface area would be 2 π〖〖 R〗_Earth〗^2 but the Sun’s rays do not strike all of this area perpendicularly). ”
What a shame there isn’t a way to calculate the intensity of the solar radiation perpendicular to any point on Earth’s surface – oh wait there actually is and it has been in use for decades in the solar industry
It is the cosine rule and these values can be averaged over the hemisphere.
Surely anyone can see the stupidity of “climate science’s” divide by four pseudoscience ?
Alan proved they got the factor of 4 wrong and the evidence of every solar panel produced on Earth has it’s output rated under 1000 W/m2 intensity not some ridiculous 239 W/m2.
Just a thought and I may be wayyy-off here but …
If these AGW modeling types believe that the Earth can be represented by a disk facing the sun, then what temperature do they think the other side of the disk is? The dark side of the disk.
Is it warmer than the dark side of the moon but Earth has all that ocean water and atmosphere still retaining some of it’s warmth? Or is it suppose to be super cold?
Basically is it that the bright side of the disk ‘should’ (by their logic) equate to the average hot Earth (average Tmax?), so the dark side should be cold (average Tmin?).
Just a thought.
What I find interesting is that people sold on a wrong idea go to all manner of effort to create ridiculous analogies in mind-numbing, painstaking, meticulous detail — analogies that turn out to be ridiculously wrong, but which serve as great distractions to boggle the minds of those people who are truly trying to understand.
If a greenhouse doesn’t work, then let’s use steel greenhouses. If that doesn’t work, then use electric circuits. If that doesn’t work, then let’s use car trips. If that doesn’t work, use pigs roasting on grills. And that’s just the short list.
SAVE ME ! I can’t take any more ! (^_^)
If you don’t understand what I just wrote, then imagine that I am a fisherman in a boat that measures three meters by two meters, and the height of the lake that I am fishing in is particularly low, because the number of days of rain this month went up from three days to twenty days. My fishing line is also not the standard weight that I use, and so my average fish count per trip has gone down by three, since my line breaks twenty percent of the time. Now the fish bite pressure, because of the low lake level has also decreased, due to low waters producing an abnormal abundance of algae, which increases the fishes intake of algae, which just happens to have an adverse effect on fish nerves controlling jaw strength. And so on and so on ad nauseum.
Love those first two paragraphs Robert.
They ignore and misrepresent ANYTHING that ends up being convenient for them to do so tom0mason…
Its 4:00 am, surface air temp is about 40 F. sky is clear. Surface air is compressed by gravity 14.7 pounds per sq in.. Sun rises. Compressed air gets much hotter when heated than uncompressed air. Hence the missing temp from the solar calculations. Regards Jeff O
“The geothermal heat is negligible…measured in milliWatts. What is it: 91.6 mW/m^2 or 0.0916 W/m^2.”
But that is 0.0916 W/m^2 GREATER than what we receive from the Sun.
It’s another great debunking of GHE.
I’ve heard that the sun provides 99.97% of the available energy; giving the impression that the Earth provides 0.03%. Nuh uh, the Sun provides 99.97% of what the Earth provides!
(Numbers not exact)
“It’s like saying the average person has one testicle.”
LMAO. Great analogy!
Hey did you guys know that Nigel Farage actually has one testicle?
He’s got more balls than most of his countrymen.
Right I get you now…distinction between energy vs. heat. I’ve missed that…wow. Good point Zoe – impressive.
So that means that geothermal energy provides a baseline ground surface temperature already around 9 Celsius!?!
I mean…!!!
I think that the distinction between heat and energy is lost on *them* though. I don’t think they actually mean a heat flux…else surface temperature wouldn’t decrease anywhere below 9C.
Talking about a perfect comment I picked this up on the Heartland Institute site. I steered him to your links, Joseph, but sadly I’m sure he’s bought and paid for. Still it’s a perfect example of what you are fighting.
“Bering a cold-blooded ruthless libertarian I am sick and tired of hearing the salesman of the fossil-fuel industry whine and cry about the climate science that is extremely well understood. It is the summation of all secondary greenhouse gases: O3, CO, CO2, CH4, N2O, CFCs and HCFCs that directly determine the amount of primary greenhouse gas, H2O in the atmosphere. Without the secondary greenhouse gases, the mean temperature of the Earth would be -18C. Since 1880, a doubling of CH4 and a 46% increase of CO2 has resulted in an increase of H2O in the atmosphere of about 7%. The sum total of those greenhouse gases has raised the mean temperature of the Earth’s surface by about 1C. Consequently, the more secondary greenhouse gases we inject into the atmosphere, the warmer the planet will get. That’s not a conspiracy, just physics.”
Yes climate clown physics on full display.
Morons.
CH4 is measured in parts per billion, so what does a doubling of that really affect?
In the past ten minutes, the number of pico-seconds that I have aged has skyrocketed.
Nah, they don’t ignore context much?
“I don’t think they actually mean a heat flux…else surface temperature wouldn’t decrease anywhere below 9C.”
I don’t know, I’m not a physicist or geologist, I’m just an economist.
Here’s what I do know:

Denmark!
Norway!

Why the eff am I doing science, and not the climatologists? What a disgraced field it has become (or always was)!
Well…without conductive and convective cooling during winter, and given the slow rate of heat diffusion through rock/soil, and if it were restricted to radiative cooling only…perhaps you’re right, that the surface temperature would be maintained at such values, ie much warmer than we’ve been thinking by geothermal energy.
If the total energy is only those milliWatts, then the surface would only be maintained near absolute zero…but if that value is a current actuall heat flux…then…it would still maintain much higher without the Sun.
“Geothermal stations use 404 square meters per GW·h” -Wikipedia “Geothermal power”
I notice there’s no time figure, so assuming they meant GWh/yr, not GWh, we get:
10^9 / (365*24) / 404 = 282 W/m^2
“An entire geothermal field uses 1-8 acres per megawatt (MW)” – US DOE
8 acres = 32375 m^2
1000000 W / 32375 m^2 = 31 W/m^2
1 acre = 4047 m^2
1000000 W / 4047 m^2 = 247 W/m^2
Unfortunately, I have no idea what m^2 is under the dirt, so I have no idea if this math was useful.
“If the total energy is only those milliWatts, then the surface would only be maintained near absolute zero…but if that value is a current actuall heat flux…then…it would still maintain much higher without the Sun.”
Exactly. The first choice is ridiculous, and the second … surprising and unbelievable at first glance.
Joseph and Robert,
You both like reading this stuff I stumbled upon it and thought you might be interested in reading it and if not no harm no foul. I don’t look for this stuff it just seems to find me.
Click to access CIA-RDP79B00752A000300070001-8.pdf
The first few pages are fluff but scroll down a bit these are Doomsday Scenarios released recently from CIA but I think it’s the 1960s. I found it very strange.
HOME PAGE:
https://www.cia.gov/library/readingroom/home
Personally I said “WTF am I reading?” but maybe you’ll get more out of it or maybe not.
-Cheers you brilliant beautiful bastards
-Zoe I’m glad you found this place I thought it would be a good fit for you. For someone who claims you’re not a physicist you know more than these climate clowns.
Because I found the straight trigonometric explanation of hemispheric flux obscure and hard to understand, I had to find a way to visualize it, and, thinking that I have succeeded in this, I did the following:
Click to access FlatEarthTheoryRevealed.pdf
Ok I think something has become confused. The *intercept* of sunlight IS a disk. And it gets spread over a hemisphere. The Earth does NOT intercept more than the disk…i.e. not more than the shadow it projects.
Yes, it is a disk, but it is NOT the size disk traditionally used to explain the divide-by-four step, as I see it.
The proper disk that accounts for the full area of a spherical hemisphere is pi/2 larger than the shadow disk. The shadow disk is a PROJECTION of the surface area, which squishes out the real surface area that real flux covers, again, as I am seeing it.
As I see it, when you figure the angles, using the trig, you are, in effect, accounting for that increased surface area, which is the same as making the intercept DISK bigger, INCLUDING this surface area from the get go.
In other words, the traditional “greenhouse theory” explanation is “flat Earth” on a deeper level than was previously obvious.
It is the wrong-size flat — not enough flat there to even be flat wrong. It is lacking even in its own wrongness.
Only a real time 3-D model of the Earth and Sun will put this argument to rest. Sadly the only ones with the money to do that are the ones who don’t want the true energy budget revealed.
CM and others, in case you are not understanding, … I am not arguing that the flat disk is an incorrect concept for a surface area receiving solar flux at the distance of Earth from the sun.
Rather, I am arguing that the flat disk traditionally used ignores the real-world geometry of how a sphere is illuminated.
A disk the size of Earth’s shadow is a PROJECTION of the surface area that the sun illuminates. It fails to allow for enough of the hemisphere to be illuminated, even though a trigonometric accounting for the angle of incidence appears to save it from total failure.
While the traditional disk does allow for this trigonometric accounting, it does not allow for the proper amount of surface area over which this accounting takes place.
I continue to study this, in case I’m making possibly really big screw ups on my part, in thinking this way.
The numbers work. I get exactly what Alan gets, coming at it from a slightly different approach.
In case it is not clear, I am in total agreement with Alan now.
RK you are completely right. Having just joined this discussion I’m amazed that this seems to be new knowledge. As a pilot by trade we learnt about the distortions of earth projections (think mercator and the distorted views in atlas’s). Hence we fly in ‘great circles’. A straight line from London to Los Angeles is a far greater distance than the round route flown via canada. Of course the earth is far from a perfect sphere – its a bit squashed – flying round the poles is a shorter distance than flying round the equator. I must dig out my old Navigation training notes which covered all this.
RK No, not at all.
I’m saying to prove the real energy budget a 3-d model is the only real way of showing it and that would take a grande sum of money and real solar physics. Isn’t it weird they spent so much money on the Cern Super Collider yet never has anyone built a real time 3-d program of the Solar input to Earth? A fact that would prove or disprove all of these theories once and for all. I find that very convenient.
Not like NASA could do it they’d make the Suns temp on the Earth -18 degrees.
Could a proof of disk size be formed by using the actual surface area of the hemisphere?
Area of sphere = 4πr² radius of earth = 6,370kms surface area of earth = 5.09904 x 10pwr8 kms
divide by 2 and we have the intercept surface area, then apply trig ratios.
The only real measure of the intensity of plane parallel radiation falling normal on a hemisphere is the sine or cosine rule, depending on your initial viewpoint.
Any vector (e.g. the Sun’s radiation) has magnitude and direction.
For intensity at a plane surface the maximum occurs normal to that surface – it makes a right angle to the plane.
At any other angle you can construct a right angle triangle with the hypotenuse as the magnitude of the vector (1368 W represented by some length) and you calculate the components of this vector in the directions at a right angle (normal) to the plane and parallel to the plane.
The normal value is in the case of sunlight on a hemisphere the intensity at that point and is represented by the sine (or cosine depending on your viewpoint) of the angle to the plane.
This is basic Statics which Engineering students learn in first semester. Often forces are inconsiderate enough to act in inconvenient directions and it is necessary to calculate bending moments in Cartesian co-ordinates.
If Engineers followed climate “scientists” there wouldn’t be a structure left standing !
Oh lord…we’ll have bridges collapsing and wings snapping…because they will have figured that AVERAGE force gives the same result!!!!!!!!
“Christopher Marshall says:
2019/06/13 at 9:10 AM
I’m saying to prove the real energy budget a 3-d model is the only real way of showing it and that would take a grande sum of money and real solar physics.”
It has been done many times and forms the basis for deciding if the installation of solar panels in a given location is viable. Many sites involving solar panel installs have charts and explanatory models available.
Note that every solar panel is rated against a normal insolation of 1000 W/m2 and not the stupid 239 W/m2 or whatever other ridiculous values these climate fools cite !
NASA (yes NASA) had some real solar models on line but have removed them recently. They were never fully developed buy contain useful information anyway.
https://www.dropbox.com/s/zpt6dqqwoi1xpl9/Solar%20Radiation%20and%20the%20Earth%20System.pdf?dl=0
https://www.dropbox.com/s/yowwis8pcf8oao4/Solar%20Insolation.pdf?dl=0
NASA knows how to do real science and engineering – it is just the Goddard Institute for Space Studies that believes in fairy dust !
Robert, I think the only problem with your analysis is the sun side. The sun also has a pi/2 factor for emission. No?
You figured out there pi/2 more earth, but there is also pi/2 more sun – in the
flat sun and flat earth model.
The 1361 W/m^2 is Direct Normal Irradiance (DNI)
Divide by 4 gives you DNI. That’s not the full story.
Here is a useful guide:
https://www.slideshare.net/mobile/SolarReference/solar-resource-measurementsnorbertgeudersfera2013
Of direct interest is pages 13,14,15
Of secondary interest is pages 17 and 19. Look at the NATURAL variability!
DNI is not as relevant as Global Horizontal Irradiance.
Take a look at this:
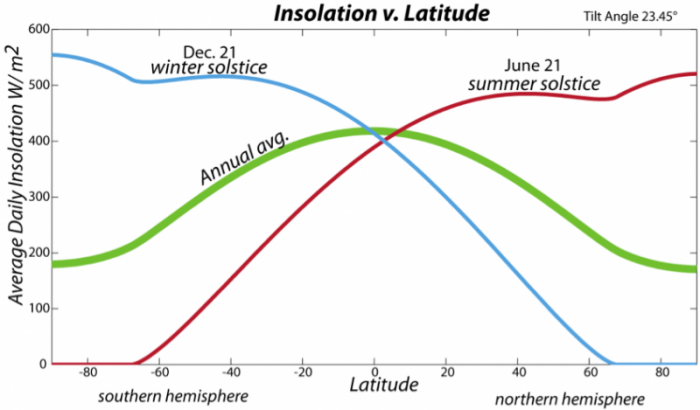
The average looks closer to 300 than 240, so Siddons and Kernodle are correct for GHI.
The divide-by-four crowd is correct about DNI, but since that’s not relevant, their point is meaningless.
-Zoe
Zoe P,
I trust the solar power calculation. Not seeing where your pi/2 comes in there, because the sun’s output is figured for the full, correct total spherical surface area of the sun — no projection going on there, as I’m seeing it.
The problem is at the source of Earth’s intercepting solar flux. How is that flux best thought of intercepting the Earth sphere? Greenhouse people see the Earth-shadow disc as the correct disc, which, again, is a projection of the actual surface area on which flux falls.
Trigonometry, as I see it, is taking account that this disk is merely a projection — in a sense, effectively reversing the projection back onto the proper-sized intercepting disk to account for the true area on which the flux falls, in order to find the appropriate component of the flux vector at a particular latitude.
I do not see my disk in conflict with this. The flux still diminishes according to the angle of incidence, but the full, true surface area over which this flux takes place is now better revealed.
“thus meaning that the hemisphere is heated at a *higher* factor than simply S/2 (let alone S/4). It is more like S/1.7 for the hemisphere.” – JP
I think this might be backwards.
The energy flowing through the area of the red circle is diluted to the area of the blue circle. You get a PI/2 reduction of flux – not increase.
Let’s double check.
Horizonal Irradiance:

Normal Irradiance:

Normal / Horizontal = 59 / 37 = 1.59
PI / 2 = 1.57 . Same thing.
The actual figure is 59.1 MJ/m^2/day =
59100000 / (60*60*24) = 684 W/m^2
If we divide by two hemispheres, we get 342 W/m^2 for DNI.
For horizontal we get:
37000000 / (60*60*24) / 2 = 214 W/m^2
342 / 214 =~ PI/2
Note that this horiozontal is TOA, and is distinct from GHI discussed in my previous comment.
Zoe,
I think you might have clarified what I’m trying to show. I think that the area of the red disk IS diluted to the area of the blue disk by greenhouse theory — THAT’s the problem. The blue disk is getting more flux than the red disk, and so NO dilution should be taking place, but rather the full flux on the blue disk is what should be “averaged” by the blue disk’s surface area.
More flux, thus, is going onto the hemisphere than the divide-by-four maneuver is allowing for. The flux still diminishes according to the zenith angle, but the way it distributes and adds up is still more overall than the red disk allows.
Visually, if you fold that red disk onto the globe, it does NOT cover the hemisphere — it falls short. On the other hand, if you fold the blue disk onto the globe, it covers the entire hemisphere, because it is the proper surface area over which the average should be accounted for.
The SURFACE AREA of solar illumination is more than the red disk. The red disk is merely the PROJECTION of the surface area of solar illumination.
I’m not saying that the hemisphere gets more illumination than it gets. Rather, I’m saying that the geometry of how this is distributed is screwed up in the standard greenhouse presentation. Again, my numbers agree exactly with Alan Siddon’s numbers. I’d be one lucky sucker, if this were just a coincidence.
Zoe,
I forgot to mention, sorry, but the graphs you present make my eyes go double — I cannot make heads or tails out of them. They are useless for helping me understand anything. Forgive my shortcomings. That’s why I need strong visuals, and that’s what I’m trying to make.
Thanks for your input.
Robert
“The SURFACE AREA of solar illumination is more than the red disk. The red disk is merely the PROJECTION of the surface area of solar illumination.”
Direct normal sunlight only falls on the red.
Horizontal sunlight falls on the blue.
“The blue disk is getting more flux than the red disk”
Only the red portion of the blue disk is getting direct normal flux.
In your diagram, those perpendicular sun rays should not go beyond the edge of of the red.
It makes it look like DNI goes to blue as well, when it doesn’t. It goes to space. It is not intercepted.
Robert,
In the standard model, the sun is a flat disc sitting just outside the earth (just like your red disc). It has a uniform irradiance of 1361 W/m^2.
Diagram: |( )
You can dilute incoming uniform DNI of the disc by 2 for a hemisphere.
Or you can compute average horizontal irradiance factor (2/pi) and multiply by greater surface area factor (pi/2),and the result will be exactly the same.
As Joe said:
“The intensity of sunlight decreases with increasing surface area it falls on”
“the angle of incidence is an important factor too because this reduces intensity.”
Increased area but reduced intensity = 1.
You transformed a uniform small sun disc into a cosine gradient larger disc.
The result is the same.
What did I do wrong?
Robert,
Just to clarify:
“The blue disk is getting more flux than the red disk”
More flux over more area. Flux Density (W/m^2) remains the same.
Red disc has uniform TSI = 1361
Blue disc has gradient ranging from 0 to 1361, with an average irradiance of 2/pi*1361 over an area pi/2 larger than red disc.
Flux density = Same.
All that matters is ratio of surface area of sun disc to hemisphere. And it’s 2.
Yes, the blue disk is a gradient, I see that now.
Somehow, though, my own confused sophistry got me to a correct result. (^_^)
I’m still trying to figure out how my wrong seems to get me right. (^_^)
I don’t know what I am doing, but, at least my not knowing what I am doing agrees with somebody who does know what they are doing, unlike greenhouse folks, who don’t know what their math means as well as its not agreeing with the truth.
Thanks again, Zoe, for your time on this.
Robert,
I don’t know what I’m doing. I’m just doing it, and lettings others decide if I’m wrong.
“I’m still trying to figure out how my wrong seems to get me right.”
Because you didn’t know the sun was flat! and same size as earth, sitting on the edge of earth 🙂 LOL, but seriously,
There’s math already embedded in that nonsense, that is not obvious.
Just to confuse you some more, planet tilt angle matters too:
Zoe, who are you, where are you from/residing, and how/why did you get into this? I’ve witnessed your argumentation on other forums, and you are quite singular in your ability to think, analyze, comprehend, judge, summarize, etc. Your grasp and cognizance of rhetoric is nearly unparalleled. What made you this way? You have a fan.
So in my humble mind I think it’s clear these climate geniuses should be doubling the energy from the Sun. I mean if solar irradiance covers the whole Earth then the entire Sun (including the side not facing us) should be irradiating to the Earth as well. So they still got it wrong, by their own math deductions, the solar output should be doubled.
JP,
I was born and raised on a small island in the mediterranean. I had plenty of time to wonder about nature. My mother died when I was young, and I was mostly raised by my father, a well respected civil engineer. I got a full scholarship to a NY university, and I studied economics. Then I went to work for wall street for 10 years … Now I know everything. My specialty was analysing energy companies.
Currently I’m residing in Atlanta, raising my 2 children with my wonderful husband (genius electrical engineer and entrepreneur). I’m 33yo. I’m retired for now, but I may to decide to work again when my chilren are old enough.
No, you have a fan. I read your “Fraud of the …” series like 2? years ago. I’ve been posting links to your site on youtube for nearly 2 years.
I don’t know what made me this way, but I like simplicity and clarity.
I forgot to thank you for your kind words 🙂 Thank you.
You are a very brave man. I admire that.
Cheers Zoe!
Nice to be able to put some context to the name. 🙂 And thank you for the kind words too!
All the best.
The projection method cannot possibly be correct because it cannot give flux normal to all points on a hemisphere. Here’s a summary from a textbook ” Note that it is the area of Earth projected against the Sun’s rays that enters here, not half of the surface area of Earth. (Half of Earth’s surface area would be 2 π R_Earth ^2 but the Sun’s rays do not strike all of this area perpendicularly)”.
IT is the flux NORMAL to the plane of Earth’s surfaces at every point on the irradiated hemisphere that is important not the average !
This is not an argument that the average is a proper model for anything – it is an argument that they can’t even get their model right in the first place ! The irony is delicious.
If you say the projection method is correct then you have an average hemispherical flux adjusted for albedo of 0.3 equal to 478.8 W/m2 for an average hemispherical temperature of ~30°C.
If you say the cosine method of calculating the flux normal to every point on the hemisphere gives you the flux normal to the plane at that point ( IT DOES !) and then you sum this data and perform a standard mean calculation then you have an average hemispherical flux adjusted for albedo of 0.3 equal to 609.6 W/m2 for an average hemispherical temperature of ~48.86°C.
This may seem high but the assumption of a hemisphere with uniform thermal properties is absurd anyway !
However, 2/3’s of the illuminated hemisphere of Earth is subject to NORMAL flux WELL in excess of the average of 609.6 W/m2 so it is impossible that the projection on a disk divided by 4 is correct !
The calculation of the flux normal to any point on Earth’s irradiated hemisphere by the cosine rule is scientifically and mathematically correct, the calculation of the mean by summing all the data values is absolutely scientifically and mathematically correct and yet people are arguing that climate pseudoscience is right ???
Put the calculations into a spreadsheet and let it do the work !
Zoe said
“Or you can compute average horizontal irradiance factor (2/pi) and multiply by greater surface area factor (pi/2),and the result will be exactly the same.”
So W/m2 and W are the same thing ?
Why is everyone talking gobbledygook ?
The maths of the cosine calculation (or sine depending on your viewpoint) is right or are we now denying Pythagoras and all of engineering ?
I’ve been giving this more thought, and I’ve decided that my agreeing that the blue disk is a gradient was wrong. The blue disk is no more a gradient than the red disk — the blue disk exists in the full flux, just as the red disk exists in the full flux — they are both in the same plane receiving the flux.
Even though the red disk accounts for the PROJECTION of the solar flux onto the hemisphere, it does NOT account somehow for the full area of the hemisphere upon which flux falls.
This is illustrated by the red-disk area folding ONLY onto the hemisphere’s PARTIAL surface area (as pictured in the top illustration), while the blue-disk area folds onto the hemisphere’s ENTIRE surface area (as pictured in the middle illustration).
I don’t know how to make this jive with the trigonometry. I only know that something about it seems to work.
I hope I’m not digging myself deeper into my confusion. If nothing else, this is an exercise in observing how deeply confusion can perfect itself. (^_^)
I said – “However, 2/3’s of the illuminated hemisphere of Earth is subject to NORMAL flux WELL in excess of the average of 609.6 W/m2 so it is impossible that the projection on a disk divided by 4 is correct !”
OK looks like I forgot albedo citing the graphic !
Still does not mean the cosine calculation or the 2/pi calculation is wrong – it isn’t !
Therefore 2/3 of Earth’s irradiated hemisphere is subject to an albedo adjusted flux of 478 increasing to ~957.6.
“Joseph E Postma says:
2019/06/12 at 6:40 PM
Ok I think something has become confused. The *intercept* of sunlight IS a disk. And it gets spread over a hemisphere. The Earth does NOT intercept more than the disk…i.e. not more than the shadow it projects.”
And yet the simple calculations I’ve shown and an average hemispherical flux and temperature kinda look like a diagram I’ve seen before:-
What’s changed ?
Robert Kernodle said somewhere earlier “Climate science has been using an intercept disc of the wrong radius ???”
Well Kinda Yes and No. But FORGET DISKS – they are only a shadow of reality !
It really is simple – For the solar constant at Earth’s orbit forget about spheres and apply the inverse square law using NASA data as shown here : –
https://www.dropbox.com/s/603zn4djrbgjy34/Inverse%20Square%20Solution.docx?dl=0
For the flux incident over a hemisphere apply the sine law as Alan does or the cosine law as the author of Earth’s climate engine does – the graphic with the various values of solar radiation around the hemisphere – using whatever current value of the solar constant you choose – 1368, 1361 (NASA), 1370 …. – all are cited somewhere or other.
Using these gives the average flux normal to a hemisphere as 2/pi or ~0.6366. Look at the diagram from Joe’s “A Discussion on the Absence of a Measurable Greenhouse Effect” I posted above and note – Continuous hemispherical input = Solar constant(1 – albedo) x 0.637 = 49°C !
2/pi = ~0.637.
Meant to say the sine or cosine laws are “complementary” depending on your view point.
Alan used a protractor with angles measured from 0 for the plane to 90 for the zenith. Joe’s graphic is the same viewpoint – looking down.
The graphic from Earth’s Climate Engine uses 0 degrees to simulate the equator in North South co-ordinates and has 90° at the top so the cosine of latitude is appropriate.
As to all the other variations such as time of rotation angle of tilt etc etc climate “scientists” use a simple model where by we “stop” the world and look at it.
No matter what season it is in either hemisphere or the change in axial tilt the Earth is still irradiated over a hemisphere !
One thing that does matter though is that at Perihelion the solar “constant” is ~1,408 W/m2 and at Aphelion it is ~1,316.8 W/m2.
Currently the northern hemisphere winter is at Perihelion with ~1,408 W/m2 TOA. Some time this will change and summer will have ~1,408 W/m2 TOA instead of the current ~1,316.8 W/m2.
Does this mean much hotter summers and colder winters ?
Your guess is as good as mine.
I still think it is delicious irony that climate science cannot even make a reasonable guess for the fundamental basis for the greenhouse effect !
Robert,
The blue does not get solar normal rays, only the red does.
Rosco,
“So W/m2 and W are the same thing ?
Why is everyone talking gobbledygook ?”
Not cool. Maybe you confused something?
Zoe,
The way I have set it up, the blue disk is just an extension of the red disk in the same time, same space, same plane — how can this set up NOT get the same full flux as the red disk? — It has to. Again, I don’t know why it works or how to reconcile it with the trigonometry of Rosco’s spread-sheet approach. All I know is that it agrees with Alan Siddon’s numbers.
Still thinking about it.
The underlying problem is the fundamental wrong assumption that flux (whether over a hemisphere or over the whole sphere) can be distributed over an area for which it is never defined to exist, in the first place — it cannot. In greenhouse-effect math, flux is first defined for a given, specific surface area that establishes its correct mathematical/geometric/physics definition. Then that very definition itself is perverted, leading to a meaningless average (algebraically correct, but physically meaningless and absurd).
So, I guess, it’s no wonder that I can come up with a weird geometrical variation of a fundamentally wrong approach. But my wrong seems to be more right. (^_^)
My sunshine is magical — it refracts through an imaginary lens. It “knows” that it needs to fold onto the sphere as a gradient.
Can I get some funding now? (^_^)
Robert is making the error of attempting to transform a hemisphere into a disk ! Such a transformation doesn’t happen – it may have 2 times the surface area but the transformation doesn’t result in a disk. Try it with an orange or recognize the problems for cartographers.
Zoe said “All that matters is ratio of surface area of sun disc to hemisphere. And it’s 2.”
I may have misinterpreted you but from that statement I assume you completely agree with climate science ?
The irradiation normal to the disk projection of Earth’s “shadow” is 1368 W/m2 – no argument about this.
Are you saying that to calculate the irradiation over a hemisphere it becomes simply a matter of area and hence the 1368 W/m2 is simply divided by 2 = 684 W/m2 and applying the uniform albedo reduces this to 478.8 W/m2 with an average temperature potential over the hemisphere of ~303 K?
And yet Climate science textbooks state _ “Note that it is the area of Earth projected against the Sun’s rays that enters here, not half of the surface area of Earth. (Half of Earth’s surface area would be 2 π R(Earth)^2 but the Sun’s rays do not strike all of this area perpendicularly).”
Further the average over a sphere is 239.4 W/m2 and an average temperature potential over the sphere is ~255 K ?
The ONLY way to calculate the irradiance NORMAL to any point on a hemisphere is the trigonometrical solution and the area ratio of a disk to a sphere is irrelevant when calculating flux values in W/m2.
It is funny that they say “but the Sun’s rays do not strike all of this area perpendicularly” and then treat it as if their own objection doesn’t matter by simply using area factors alone anyway !
Flat Earth Physics !
And I’m guessing that you are saying the hemispherical average of flux NORMAL to every point on that hemisphere, which is 2/pi, is wrong ?
The average hemispherical flux conversion factor NORMAL to every point on that hemisphere thus calculated isn’t 0.6333 (it is 0.5 due to double the surface area) ?
The average flux value isn’t ~609 W/m2 with a potential temperature of ~322 K or ~49°C ?
Well unless something has changed his mind over the last 7 years Joe does not agree with climate scienc’s analysis based on areas alone as his grapic indicates
Zoe said –
“Or you can compute average horizontal irradiance factor (2/pi) and multiply by greater surface area factor (pi/2),and the result will be exactly the same.”
I admit I do not grasp what you meant as the meaning of this statement. The 2/pi is the factor NORMAL to any point on a hemisphere.
However, if you compute average horizontal irradiance factor (2/pi) and multiply this by 1368 W/m2 ( the solar constant NORMAL to the disk) you have a W/m2 value NORMAL to every point on a hemispherical surface.
If you do what you say – “and multiply by greater surface area factor (pi/2),and the result will be exactly the same.” – you are now transforming flux in W/m2 into joules per second and THAT IS NOT THE SAME !
As I said I may have been mistaken in what you are saying but I don’t think I agree with you if you are dismissing the cosine (or sine) rule for transforming a random vector into its normal and parallel components because that is REAL science and the gobbledygook professed by climate science denies this by dismissing it.
Rosco wrote: “Robert is making the error of attempting to transform a hemisphere into a disk !”
Yes, I am showing the reverse process of the greenhouse-effect folks. If you can fold a disk onto a sphere, then you should be able to unfold that folding into the original disk. I am trying to use this disk/sphere sophistry to find out, in greater depth, what’s wrong with the approach.
And I think you nailed it — you cannot make a flat disk into a sphere in a realistic way. A projection of a hemisphere is NOT the physical reality of the hemisphere — it lacks something critical.
Here’s what I’m thinking now:
Rosco,
We already established that the Earth doesn’t need the Sun for thermal power, only light and UV. The Sun provides 99.97% of the energy that the Earth does. Without the Sun, and without an atmosphere, the Surface would still be ~15°C.
So of course climate “science” is wrong.
Sorry, but your comment is too confusing for me to follow. Thanks tho.
Have not been here for some time and have not read everything in detail, so I dont want to get in trouble here, please 🙂
Concerning Rosco’s Figure 7 Solar Irradiance on The Earth… The radiance is not on one meridian at a time, it’s on the whole half sphere. So, I have to take the double integral from -Pi/2 to Pi/2 of the function COS(x) * COS(y) dx dy to find the total flux the earth receives at any moment. This integral gives exactly 4.00. So the surface the Sun sees is 4.
Hope I did not make a mistake. Being 71 years of age does not help 🙂
Hope it helps somehow, somewhere.
Pierre B,
“4” is pretty abstract. I’m not sure what to do with it, but I’m fascinated that your double integral is from -Pi/2 to +P/2, and that you use of the idea of the sun’s “seeing”, because I think that this is what I have been getting at — the sun “sees” the surface along the curved path, from the bottom of the sphere to the top of the sphere, NOT the straight path from one end of a flat disk to the other.
I think this is what I have been getting at.
Zoe Phin says:
2019/06/16 at 11:52 PM
“Rosco,
We already established that the Earth doesn’t need the Sun for thermal power, only light and UV. The Sun provides 99.97% of the energy that the Earth does. Without the Sun, and without an atmosphere, the Surface would still be ~15°C.”
I am always suspicious when I see statements like the one quoted – perhaps the words in our opinion rather than already established would be more accurate – I ‘ll leave it at that.
Pierre D. Bernier says:
2019/06/17 at 2:38 PM
“Concerning Rosco’s Figure 7 Solar Irradiance on The Earth… The radiance is not on one meridian at a time, it’s on the whole half sphere.”
Pierre – it isn’t my diagram – I copied it from Earth’s Climate Engine available here http://junksciencearchive.com/Greenhouse/Earth-s_Climate_Engine.pdf
It simply shows that a large proportion of a hemisphere is subject to high levels of solar radiation rather than the ridiculous claim by climate science that the solar insolation is 342 W/m2 on average before albedo.
I am aware that the Sun irradiates the whole sphere – this has been a part of the discussion over whether an average derived from area comparisons between a disk and a sphere can in any way provide a reasonable model for the power of the solar radiation and power the climate.
The discussion turned to whether climate science’s model for the greenhouse effect is totally in error because a hemisphere is irradiated, not a disk surface, and it is possible to calculate the irradiation normal to every point on this irradiated hemisphere using the cosine rule to split the angular solar radiation into its components at all points on the hemisphere and calculating an average irradiance for the hemisphere.
This discussion considered the irradiance over a semicircle to find the average value. Of course an average value is nonsense but it is ironic to note this produces a larger value than the 0.5 climate science would us and changes ALL of their subsequent modeling !
Doing this gives the result as 2/pi – ~ 0.6366 versus the value of 0.5 used by climate science.
It has been more than 30 years since I was in University maths so I am rusty at calculus.
I’d need to do some revision about your double integral but I suspect it calculates the AREA ratio of a circle to a sphere and NOT the flux normal to this area.
For the flux normal to any point on a hemisphere you need MORE values than you have – your COS(x) * COS(y) are ONLY AREA co-ordinates – you also need a value for the radiation normal to every set of these co-ordinates so you need another set of COS values where this one is the angle between the direction of the sun’s radiation vector and the angle of incidence to the ground surface.
There is a point on a hemisphere with co-ordinates x,y but the irradiance normal to this point is ANOTHER cosine of the angle of incidence at this point normal to the plane. It quickly becomes complicated to write the expressions.
Calculating the radiation normal to thousands of points on a semicircle using the cosine rule gives a result approaching 2/pi – I did this in a spreadsheet using 3601 values both from 0 to pi using sine and minus pi/2 to +pi/2 using cosine. The result is 2/pi.
Considering thousands of these concentric semicircles at angles to the original semicircle rotated through 180° (or pi if you like) gives the same result for each and although the total sum of all of these is obviously larger so is the number of data points so the average doesn’t change.
If I take the semicircle in figure 7 and rotate it by say 30° into the page it is still a semicircle with the same irradiance on it as if I hadn’t rotated it at all because it is irradiated by the plane parallel solar radiation.
I could be wrong though, but your value of 4 means what ? I think it is simply the area of a sphere is 4 times the area of a circle.
It can’t mean the irradiation over a hemisphere is 4 times that over a disk nor can it mean it is 1/4.
1368 x 4 average – sorry I don’t buy that and neither do I buy 1368 x 1/4 average.
Using figure 7 and the cosine of the Sun’s incident angles as a model only means that the sun sees the earth as a flat square surface of area 4r^2, r being the radius of the Earth but a flat square none the less. Of course the energy received near the equator is stronger then at the poles or near the edges. That’s what the cosines are saying. The double integral only gives us the total sum of all the energies received by the Earth on all of it’s surface at any moment.
Oh, and no it’s not a reasonable model for what actually happens ! It;s just a sum total of the energy received.
From figure 7 if we consider the North-South axis as y then the incident energy at any y value on the meridian is 1368*Cos(y). If we consider the East-West axis as x, then the incident energy at any x value on the equator is 1368*Cos(x). Therefore, at any point x,y the incident energy is 1368*Cos(x)*Cos(y). The sum total of incident energy on the exposed sphere is therefore the double integral over x and y, from -Pi/2 to Pi/2 of the function 1368 * COS(x) * COS(y) dx dy. Giving 1368*4r^2. The surface of half a sphere being 2Pi r^2 gives us an average of 1368*2/Pi or 871. Yes a meaningless average.
Roscoe,
“I am always suspicious when I see statements like the one quoted – perhaps the words in our opinion rather than already established would be more accurate – I ‘ll leave it at that.”
Yes, the geothermal gradient is my opinion.
I contacted all the world’s geologists and bullied them until my opinion appeared in their data.
I may be 4’6″ with skinny arms, but geologists fear me, and so do my bidding.
Here are some more of my victims:

Zoe,
I don’t have your background, and so I don’t get your charts. I don’t know what I’m looking at.
Duh — Okay, I admit it. (^_^)
Robert,
In brief: Earth Energy > Solar Energy.
Heat flows from inside to outside. Without the sun, the earth would be just as warm, except we’d have no light and just about everything would die.
Look at temperature at depth = 0 in all my charts.
Zoe,
I’m not an expert but that sounds a little confusing. The Earth’s core is as hot as the Sun’s surface (in theory?), however, I’m not seeing that geothermal heat as a constant and steady flux to the surface enough to replace the Sun…If that is what you are referring to or am I misunderstanding this entirely?
I do believe as the core is a giant nuclear reactor (as I see it) it will overheat like a real reactor from time to time in major and minor episodes. A major episode could be a ‘Near Life Extinction Event’ but a minor episode could certainly support global warming from the inside to the outside. Evidence of this would be warming oceans and (obviously) increased ocean floor volcanic activity. One large volcano can increase the ocean water around it to about 5 degrees Celsius. Imagine what thousands or tens of thousands of active volcanoes would do to the ocean’s temperature?
In theory it could support a version of global warming. A larger global seismic event could create a warming period and with enough volcanic activity the aerosols in the atmosphere would eventually create a mini ice age. This does follow a logical order (in theory). The extent of the warming and cooling is also directly linked to the solar cycles, Earth’s orbit, orbital resonance and many things beyond my equivalent sophomore college level education.
Which as I don’t know anything about geothermal energy, I don’t know why we don’t pursue that more? Releasing pressure from the Earth on a global scale I would think is a good thing to reduce seismic activity and less change of a near life ending event (as I am not a fan of those).
Again, I am not an expert, just a humble peon with too much time on my hands, apparently.
Zoe P,
That seems pretty far-fetched. So, sorry, I’m not convinced.
The head of a pin may be 6000 C but it wont give off much heat because it has a very small mass and therefore a very small energy content to give off before it cools down. The same goes for the thermosphere high up there. The temperatures range from 500 C to 2000 C yet satellites fly through it without a problem because there is a so small air mass up there hence a small energy content.
As the center of the Earth goes, the temperature may be 6000 C but since it is said that some of that heat is still there from the formation of the Earth, the escape rate seems to be low. So it’s only a question of heat budget. Low production rate with low escape rate may lead to high temperatures, but not necessarily higher surface temperatures then otherwise.
Regards,
Oh, by the way I made a mistake up there on a previous post. I don’t know why I added r^2 in the result. It should read 1368 * 4. It is implied that the surface is a disk. But, that flux density will not be spread on that disk but on the half sphere. Since a half sphere has a surface of 2Pi greater then a disk, we must divide that total flux by 2Pi which gives us 1368 * 4 / 2Pi or 1368 * 2/Pi or 871 W/m^2. Yes a meaningless average but a damn hot one. If I’m not mistaken, if we forget the albedo, etc, gives us an average temperature of 79 C. I wish those PhD’s could do simple maths 😉
I thought that geothermal HEAT flux data and geothermal gradient diagrams would be enough to convince people, but I guess great irrefutable evidence isn’t enough.
They need a messiah, and I’m not good enough. Sigh
How could an economist do physics, right?
Well, I took 3 physics classes and 2 astronomy classes in college (Yes, there were like 5 girls in a class of 50-100) and I aced them all. Does that count for anything? Sigh
🤗
I like to think of economics as people physics.
Wealth is internal energy.
Trade is energy exchange.
GHG physics is like wealth accumulation through monetary loss.
Bums have the most internal energy due to backmoney.
LOL.
This conversation is beyond my education level just trying to grasp the concept here. Joseph care to add anything?
Zoe, it is a real shame you didn’t pursue physics as a career…never too late?
Chris,
Joseph is going to think about it.
There’s been one “good” argument against me over at Spencer’s blog:
“I did look at your links. Here is something hopefully you will consider in your thought process on geothermal energy. Soil is a fairly good insulator, not the best but reasonable.
Here:
https://thermtest.com/thermal-resources/conduction-calculator
This is a conductivity heat transfer calculator. It gives the heat transfer by conductivity and the variables involved. In this form you will get Watts as the transfer rate. To get flux (W/m^2) you would just move the A (in m^2) under the Q and you would get W/m^2 flux.
I put in some arbitrary numbers to let you know how little heat flows through soil even if it is quite hot a few kilometers down.
The thermal conductivity of dry soil is given at a K value of 0.15 and for wet soil it is given at 0.6.
If you use dry soil in the calculator and have some high temperature of 100 C and the surface temperature of 0 C and the soil depth 10 meters (around 30 feet). One square meter of surface would only have 0.15 Watts flowing through it. So you would have the energy from the hot area losing this energy at a rate of 0.15 W/m^2. This is not even close to the solar input or the GHE. Both of these are much higher fluxes.”
My reply: ”
OK, so 0.15 W/m^2 creates an emission of 0C at the top.
And 1361W/m^2 gets to a -18C global average using standard method.
And your OK with this. You see absolutely no problem with this? MORON
You should publish your refutation of SB Law, because apparently 0C emits only 0.15W/m^2″
* * *
I don’t have the qualifications to do physics. I don’t like school, despite my good grades. I’m quite content just supporting those who are right.
My favorite job was actually exotic dancing, but I’m not 21 anymore.
When I was 18 my favorite job was exotic partying…If I could only remember them!
I know most mines are warm and usually the deeper you go the warmer it gets, hence if a blown out glacial ice age hit geothermal heat would save a lot of lives and homes, even cities, could be built deeper in ground.
IF the planet is warming more and since most of the info is fraudulent we aren’t really sure that is the truth, it would have to come from somewhere if not increased solar activity, sure as heck not coming from CO2, that would leave one option open: The Earth.
As I said beyond my education level I’m just not sure I’m “getting it”. As stated if aerosols covered the planet from global volcanic activity it would incur an ice age, in theory anyway. So if that is true the Earth is not providing enough warmth to by itself w/o work from the Sun. The winter side of the Earth being proof of that as a general rule.
It is also known (in theory) that glaciers only cover the Northern Hemisphere so what does that mean? I have no frak’n clue. So that’s it, I got nothing.
To pursue this conversation more you need an honest geophysicists, a good geologist or a physicists with some geology background and I am nowhere near those requirements.
“When I was 18 my favorite job was exotic partying…If I could only remember them!”
You slut. lol
Chris, there are glaciers in South hemisphere. NZ has several (Fox & franz joseph are largest), chile has lots and Antarctica is pretty much one giant glacier. Thing is there is less land mass and mountains south of 30deg sth than land and mountain north of 30deg north. Thus due to lack of suitable terrain in the cool regions fewer glaciers can form (except the giant antarctic glacier which is possibly bigger than all the other glaciers in the world combined!).
“My favorite job was actually exotic dancing, but I’m not 21 anymore.”
STOP it with that immediately! 😉 Do you have any idea what putting those thoughts into our heads does to us?! You’re already a unicorn. No need to impale our souls on your pike.
But yah…the way I’ve always thought about this problem is that there is some cross-over point in the soil where the temperature in maintained by sunlight (near to top, obviously with oscillations), vs. deeper where the soil temperature is maintained by geothermal. I have always known, from plots and such, that this cross-over depth isn’t all that deep. But your (Zoe’s) posts & plots here seems to be saying that geothermal maintains an appreciable temperature right up to the surface!
But it could be that, with the low conductivity rate coming up from the soil, sunlight is helping the geothermal energy maintain that temperature, etc.
This actually isn’t that difficult to code in a 2D (one space D & time) partial differential heat flow equation. In fact I have such code developed already. Maybe I should record some sequences as videos and show you guys.
bobn,
Sorry I thought the whole conversation and only typed part of it, my brain does that a lot. I meant glaciers only move north to the equator. I’ve never heard of them moving south to the equator. I’ve heard that is why if we did go through a real ice age everyone would have to move to the equator or south, since most of the Northern Hemisphere would be under moving glaciers. I do not know if that is true that’s just what I’ve been told.
Zoe,
Sad to say my 18th birthday party I woke up in a truck that was not mine…I vaguely remember doing donuts. It was one of my friends trucks, he was passed out somewhere else as it were. I am glad those days are gone, I was afraid of girls back then you guys were terrifying! If I had applied myself more I may have gotten to college at 16 or 17 and been on my way to a degree or two or three. Oh well.
Joseph,
I did forget that some parts of the Earth are closer to the crust than other parts and perhaps that does make a difference in heat retention from the core to the near surface.
Speaking of a degree or two you are clearly smart enough to pursue a PhD what’s stopping you? If Tyson could weasel his way into a PhD in astrophysics and other physicists think he’s an idiot, well, you’d have to a be a shoe in.
Well I have a Masters in Astrophysics, but yes, there are complete FN retards, I mean, literally, as we have seen, retarded people, with PhD’s in astronomy and physics…good Lord let alone climate science.
Chris,
“I was afraid of girls back then you guys were terrifying!
Lust + Self-Doubt .Wanna try, but afraid to lose it and be judged.
It’s OK. We like older men. Men look for hot, Women look for cool.
My hubby met me while I was sitting on a park bench.
Joseph,
I will keep investigating geothermal stuff. Will get back to you.
I’m curious, so what is the average temp @ 23.5 tilt? It’s hard for to eyeball it from his diagram. Too lazy to do the math myself.
I turned out fine (ish) been married 23 years and I don’t drink I needed my brain cells to hold steady. Now my addiction is a good cup of coffee and finding intelligent people to converse with…well besides my wife who is always smarter than I on all matters domestic and abroad 🙂
My favorite job, at 18, was exotic danceRS. Non-paying, of course, unless you count the agony of breakups as a cost.
Oh, I forgot, this is a physics topic — gravity, force, heat. But exotic dancers are hot, and so I guess it’s not all that off topic, then. (^_^)
Speaking of hot, wouldn’t geothermal figure into Earth’s emission temp? — making the 33-degree comparison between two unrelated temps even more ridiculous?
RK
you know you left an infectious disease on your site, Scott Belford, cocky chap if I do say so myself. I like this one:
“You claim the increase in temperatures represents so-called stability, lol. Even the chart you offer has proof clear shows an increasing trend, not a cyclical one which is what “stability” implies.”
That’s why I think it’s a waste of time to challenge them on global averages because the concept of a global temperature is ridiculous and so ambiguous. “Averages” may be useful for a ‘ballpark figure’ but as proof or evidence it’s not. No temperature exists in an average it exists in a real state, these clowns try and use a statistic to prove a reality. ‘Average runs’ doesn’t win ball games.
” If you used a proper scale, it would also show temperatures increasing at an increasing rate.”
Besides being just a stupid remark, where is that happening in the real world? Nowhere. Fake News just lied last week or the week before claiming New Delhi had hit record highs, I had just checked that week before the news came out and not one record broken, these people are pathological liars.
“Your chart also shows sea level rising at an increasing rate – not good.”
Average increase in sea levels is about 1-4″ a century. Satellites simply can’t measure sea level rise with any precise accuracy. They have been proven to be in error of sea level measurements of about 175mm in just 3 samples from 3 different satellites. Scientists even admitted they couldn’t account for the bias in varied satellite data. Tidal gauges are far more accurate and have actually confirmed that sea level hasn’t changed much. Generations of Islanders will attest to very little to no rise in sea levels.
“Your charts on hurricanes is misleading given the prediction isn’t that there will more storms. Instead, the prediction is the what storms do happen will be more violent…”
That’s just flat out false, “NOAA’s Climate Prediction Center is predicting that a near-normal Atlantic hurricane season is most likely this year. This outlook forecasts a 40% chance of a near-normal season, a 30% chance of an above-normal season and a 30% chance of a below-normal season. The hurricane season officially extends from June 1 to November 30.” This is from NOAA who is all in for AGW.
https://www.noaa.gov/media-release/noaa-predicts-near-normal-2019-atlantic-hurricane-season
RK and friends
Have you ever heard of Glacier Girl? No that wasn’t an exotic dancer from my youth (although it would describe a few girls I knew). It’s a P38 that crashed in Greenland around 1942 and 50 years later (1992) they recovered it. In 50 years in the glacier it had been buried under 250 feet of ice…Yeah, so much for melting Greenland.
http://p38assn.org/glaciergirl/index.htm
RK
Tony Heller just put out a video on hurricanes, contradicts everything SB claims about it. No severe hurricanes in 2018. The video is called “Hurricanes Don’t Lie – But Climate Scientists Do”.
CM,
Which site? (I don’t check in all that often, after I write sometimes — I’ll look for what I think might be the suspected site).
RK
Hubpages, Climate-Change-Reality-Review-for-City-State-and-National-Leaders
Oh, okay, I found the infection, and this was my reply:
[Scott B,
I’m just now seeing your comment (I don’t always check back regularly), so sorry for the delayed response.
If I agreed that tenths of degrees are huge, then I would not have written what I had written. Over the entire span of Earth’s geological existence, there have been periods where your supposed “huge” tenths are dwarfed by the much greater changes (up and down) that occurred, long before humans came onto the scene. We have not been in existence long enough to truthfully compare our era to previous geological eras or to separate our effect from natural effects that far exceed our current complete understanding.
Merely associating tenths of degrees, over a relatively short span of geological existence, with human industrial activity is merely making an association, and then you are magnifying this mere association with an underlying fear of human activity as being somehow unnatural, thus forcing an irrational claim that WE are the cause of those mere tenths of a degree.
And, please, your claim that 1 degree will tip the scale into a climatic death spiral is completely irrational and unfounded. Again, there is evidence that Earth has experience far, far greater changes than that, long before we were here. “Climatic death spiral” is way too dramatic to be considered part of a rational discussion of this issue.
Your focus is too narrow, thus forcing you to repeat support for the very flaw that I showed IS a flaw, but, like a child, you say, “Is too” to my “Is not”, without offering any substantial support. Again, the standard temperature chart that I offer exaggerates the “y” axis, to make tenths of degrees HUGE over multiple years, and the fact that climate science does this is precisely what I am calling a fake presentation.
Your criticism of my second, realistic temperature chart simply denies the truth of what I have already explained, … and explained again, … and you refuse to accept the explanation, instead merely repeating the same flawed claim whose flaw I explained, taking you ’round and ’round in your circle of denial of reality.
Now about sea level, first, my chart shows no more alarming acceleration in natural sea-level rise than is usual. One more time, sea level rises — that’s a feature of the Earth system. It has always risen. It has sometimes fallen. There is evidence that it has risen far more than a peon amount over centuries, in the past. If you really believe that we can define a global-ocean sea level , for which we can accurately measure inches of rise over centuries, then I fear that you are under a very false impression of human ability to gauge such things.
My charts on hurricanes completely disprove your claim of increasing hurricane intensity. Look at them again — they indicate “accumulated cyclone energy” (a measure of strength), NOT frequency of storms. As I pointed out in the article, “There has been no increasing trend in Atlantic hurricane intensity for at least the last sixty-five years and, no increasing trend in North Pacific Hurricanes for at least forty-five years.”
Your calculations, then, appear to contradict the official trend determinations. What is the time span over which you are measuring increasing force? From when, until “up through the 2018 Atlantic hurricane season”? Are you looking at the long-term trend of the charts I presented?
A short-term span in a longer-term span does NOT indicate the longer-term trend, and this is what we are interested in, where climate is concerned. You are talking about weather, if you are talking about this shorter time span in only recent years.
That’s all I can say for now.]
Well done and diplomatic, that part must be hard. I really don’t get the ‘sea level rise’ I mean we are on a planet, a round sphere with gravity and variable degrees and magnetic influence. Straining over inches is beyond my understanding of this complex system. When oceans warms they expand, cool they retract add that onto tides, continental drift, seismic activity and crap I don’t even know about and the whole thing sounds like nonsense.
Yeah, I didn’t go Postma (I mean “postal”) on him. (^_^)
Sometimes confident diplomacy can make unfounded fear look more ridiculous than raging on it. It’s hard, yes, but my exposure is limited, and so I can keep from getting too overwhelmed by the stupidity. That could change, I guess.
Meanwhile, I just did justice to a recent photo that pictured Cortez and Mann together:
Lol ‘Crazy Eyes’ belongs in a horror movie.
Heeeere’s Alexandria ! [and the movie would be called “The Greening”]
Actually, somebody else beat me to it:
THAT is terrifying!
RK
That Doc Sno is a neurotic little troll isn’t he? He trolls your site but on his site nothing but praise from the comments as if he only allows the ones that agree with him. He hasn’t addressed one thing you have pointed out he just repeats “Deny Discredit Deflect” like he’s programmed.
You should try and respond on his site and if he he blocks you I think it’s fair to remove his comments from your site as well. Personally I love throwing a stone in the water and see what comes up to the surface that way you get a good look at the real person not just the ‘persona reflection’ they want you to see.
Yes I should have taken psychology I would have thrived. Dealing with my psychotic paranoid schizophrenic family member taught me many things.
I think that I made one comment on Doc Sno’s site — I never checked back to see if he left it up. As long as he got the final word, I’m guessing he kept it up, since leaving it up with his reply, I’m guessing, would give him the false assurance that he prevailed. Had I persisted in an actual interchange, I get the feeling that he probably would have started selectively deleting me or, at least, my latest reply, again, in order to give the final-word appearance of his prevailing.
On my site now, I welcome all his comments, because they give me a chance to address each one directed at me. If he’s talking to other commentators, then I do not engage — I let them do their things. But the moment he addresses me, then, if I see it, I respond.
Self delusion is an art. Language has great creative leeway to give some people this false power.
Robert,
“Oh, I forgot, this is a physics topic — gravity, force, heat. But exotic dancers are hot, and so I guess it’s not all that off topic, then. (^_^)”
Am I hot?
ibb (dot) co (slash) rsnB45Y
Hmmm…a six? 🙂
JP,
6 times PI/2?
Just more like a 2 or 3. Out of 10.
The indoctrination of children.
https://www.thoughtco.com/how-to-reduce-global-warming-1203897
JP, Base 4?
hahah 😉 Look…just…turn around. I’m actually quite the romantic…you see…
🧚♀️
💩
😜
😁
Pingback: Skinner solen på hele eller halve jorden? - Klimarealistene