
Lukewarmer & shill for the climate gestapo, fake climate-skeptic and pretend-scientist Roy Spencer, has refused to engage in a live debate with me to discuss the merits of the foundation of climate alarmism, which he defends despite pretending to be a skeptical scientist.
I was drawn to the attention of a Facebook post by Roy Spencer in which he defended the basis of climate alarmism, a post which was also carried by Anthony Watts at “Watts Up With That”. I posted a few comments at the Facebook post pointing out the basic scientific flaws of the basis of climate alarmism, and asked Roy if he would like to have a public/live debate on these flaws which he defends.
His response?
To immediate block me on Facebook. Thus, I emailed him:
Hi Roy,
In light of your recent article, how would you like to have a quick little video discussion/debate about the geometry of the Earth and how sunlight interacts with it, and the greenhouse effect? I think that a lot of people would be interested! It could even be performed live, if you like.
Let me know, if you’re interested.
Cheers,
Joe
Roy’s only reply by email:
“If you argue with a madman, it is extremely probable that you will get the worst of it; for in many ways his mind moves all the quicker for not being delayed by the things that go with good judgment.”
-G. K. Chesterton
That’s cute. You see, I want to ask Roy if sunlight falls over the entire surface of the Earth as an input, as if the Earth is a flat plane. He knows that that’s what I want to discuss with him. He responds by pretending that this is a mad question to debate.
Indeed…it is mad. It is mad for someone to pretend to be a scientist, and to pretend to be a climate skeptic, who defends the concept that sunlight falls as an input over the entire surface area of the Earth at once, as if the Earth is a flat plane. That is quite mad indeed!
And we all know what Roy’s response is, paraphrasing:
Roy Spencer: “I find it incredible that someone with a degree in astrophysics does not understand that the time-averaged input over 24 hours on a rotating planet requires dividing a disk area by that of a sphere area.”
But see…Roy…you have not proven that I do not understand this. I do understand this. The area of a disk (the cross-section intercept by the Earth of sunlight) is πR2, while the area of a sphere is 4πR2. That’s not the issue. The issue is weather the time-averaged value of flux, which is the exhaust or output flux of the Earth, can be used to explain the physics of the climate system?
We all saw what happened when I submitted that question via a paper to the American Meteorological Society: their response was to double-down and outright state that their position is that the Sun does not heat the Earth and does not create and sustain Earth’s weather and climate. That’s Roy Spencer’s position too…along with the other shills such as Anthony Watts, Christopher Moncton, etc.
And on that topic I would like to point out something so obvious: the supposed “energy budget” such as the one below, which is the basis of climate alarmism and which lukewarmer & fake scientists like Roy Spencer defend, is not actually even an energy budget proper: it is a flux budget.
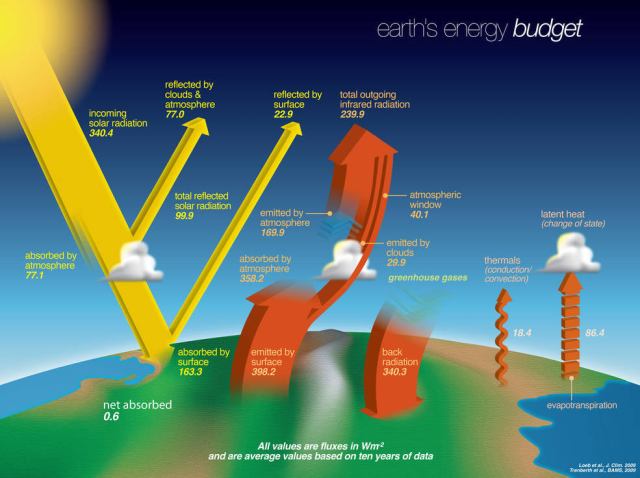
Does that make a difference…energy vs. energy flux density? Yes…it makes all the difference in the world! Energy is a conserved value, but flux is not. The physics induced by radiation and radiative heat-flow, in real time, is a function of the local energy flux density of the radiation. Energy flux density is equivalent to force, and the way that objects and substances respond to force is a real-time in-the-moment event as and where the force is applied, not as a function of that force averaged over some time period including when and where the force is not acting.
And thus to label these diagrams as “energy budgets” is a non-sequitur…what is being labeled is not what is being displayed. But the climate-incompetents then go on to develop physics based on this confusion, establishing their position that the Sun cannot heat the Earth or create the climate due to their improper treatment of flux vs. that of energy, and resulting in their postulate that the climate creates itself out of nothing via heat-recycling, in blatant contradiction to the laws of thermodynamics.
We saw what the AMS did when I pointed this out to them. It’s no wonder that a peon like Spencer wouldn’t dare debate it publicly with me!
If any readers have the care, why don’t you head on over to Roy and ask him why he’s afraid to debate some basic physics questions with an astrophysicist. Is he too afraid? Too argumentatively-weak?

And the winner is…ROTFL.
It’s been all over since I published my analysis of CO2 radiation bands and revealed that its only one within the range of -50C to +50C is centered around 15 microns, which has a Planck radiation temperature of -80C, colder than dry ice, and can’t melt an ice cube. Arguments about what keeps the Earth’s atmosphere from freezing must therefore by ruled by the fact that it just can’t be CO2. See my Nobel Prize winning essay (not yet):
http://www.historyscoper.com/thebiglieaboutco2.html
Back to the chase. All along super-physicist Richard Feynman proved that the atmosphere’s composition is irrelevant in setting its temperature. Instead it’s about gravity, pressure, and the good ole Ideal Gas Law PV=nRT.
https://hockeyschtick.blogspot.com/2015/07/physicist-richard-feynman-proved.html
Your fake geometry expose is right-on, exposing the U.N. IPCC’s dirty undies, but it’s a disproof of a lie, not a proof of the Earth’s atmospheric temperature profile like Feynman’s.
Here’s my deeper explanation of the IPCC geometry hoax:
http://www.historyscoper.com/howmuchdoesthesuncontributetoglobalwarming
“it is a flux budget.”
Brilliant.
Thank you Joe
Phillip I have missed your weather/climate insights as I have Pierre’s chemistry lessons and geran’s physics lessons. All an invaluable compliment to Joseph’s pedagogy.
To all else who have helped myself and so many others, many, many thanks to you as well and all of your accumulated efforts to further honest science forward.
Without you guys the layperson would have nothing to use as a buffer against a global controlled experiment where people are taught that a cold atmosphere can heat up the surface of the Earth more and that this is accepted science!
CDM
Appreciate that.
I mostly place my weather comments on Paul Homewood’s Not a Lot site.
I am still contributing to the science elsewhere.
I typed in “second rate skeptic” in google looking for a funny picture. The cover of Roy Spencer’s book was one of the first hits.
lol.
Upvote if you have a Reddit account please and thank you.
Well after Denis Rancour made such a fool of himself debating this with me (a layman), is it any wonder that Spencer avoids humiliation at the hands of an actual scientist?
If you argue with a madman, it is extremely probable that you will get the worst of it; for in many ways his mind moves all the quicker for not being delayed by the things that go with good judgment.
-G. K. Chesterton
If I had received such a response, then I probably would have replied with this:
If you try to reason with a zealot, it is extremely probable that you will get nowhere, for in many ways, his mind fails to move at all.
-R. G. Kernodle
And to this:
“I find it incredible that someone with a degree in astrophysics does not understand that the time-averaged input over 24 hours on a rotating planet requires dividing a disk area by that of a sphere area.
I would reply with this:
I find it incredible that someone with a PhD fails to understand that hemispheric intensity of solar power averaged over the entire sphere does NOT have any physical meaning whatsoever.
Yeah, that diagram is a flux budget, … which makes about as much sense as a color budget. But, hey, if you can show me that light blue plus light blue equals dark blue, then I might reconsider.
You know I always get this question:
If the Sun is getting cooler why is it getting hotter if the Sun is the only source of heat.
I would love to break an answer down to a simple paragraph or two with links.
The problem is I have no simple reply to that. Irregardless, it is not CO2 that can be disproved in so many ways it isn’t even an effort to challenge them anymore on that.
It’s NOT “getting hotter”. See we’re dealing with so much media propaganda from the left. The temperature is totally normal, and current variations of temperature are likewise totally normal.
The media leftist complex can just say whatever they want on TV, cheery pick a few graphs, and then all the leftists believe it. That’s all that’s happening.
Someone gave me this link…
ftp://gerb.oma.be/steven/RMIB_TSI_composite/RMIB_TSI_composite_latest.txt
From this article
https://iopscience.iop.org/article/10.3847/0004-637X/830/1/25
by Steven Dewitte and Stijn Nevens who are still updating the TSI.
The U.N. IPCC flat Earth hoax? Or should I say the Am. Meteorological Society?
They claim that you can calculate the Earth’s avg. temp. by dividing the Sun’s power by four and applying it to one-fourth of the Earth’s surface.
Duh, when you lower the Sun’s power, you turn it into a different Sun with a lower temperature, because its Planck radiation peak power wavelength is inversely proportional to its temperature,to quantum precision by Wien’s Displacement Law, and this carries over to its total power. No wonder that after cutting the power by 75% the Sun no longer can keep Earth’s atmosphere from freezing. 🙂 https://en.wikipedia.org/wiki/Wien%27s_displacement_law
To see how nuts this is, try dividing the Sun’s power by one million and applying it to one-millionth of the Earth’s surface 🙂 Or quadrupling the Sun’s power and applying it to the entire Earth’s surface 🙂 This shows that the hoaxers reverse-engineered the problem to give the solution they wanted. Why didn’t they apply the Sun’s full power to one-quarter of the Earth’s surface? Because the real problem is to calculate the average temperature over a long period of time, but the Earth is revolving, and the Sun bastes it like a rotisserie chicken while it cools, and that’s the real problem which they neatly skipped completely, i.e., they cheated 🙂
So the emperor has no clothes, and how long can they go on pushing a fake physics hoax while putting their hands out for trillions without a massive reaction?
Great comment!
“Because the real problem is to calculate the average temperature over a long period of time,”
historyscopper
Quite so. Have a look at my meteorological solution to this problem for the earth using an areal weighted sum of the average surface temperatures for the three atmospheric circulation cells (Hadley Ferrel and Polar) computed from knowledge of 1. Tropopause temperature (the radiant exhaust), 2. Tropopause elevation (pressure proxy) and 3. Thermal lapse rate for each cell.
Glad to have you back and posting Joseph!
” It’s NOT “getting hotter”. See we’re dealing with so much media propaganda from the left. The temperature is totally normal, and current variations of temperature are likewise totally normal.”
I just looked at radar/satelite data and you can follow the heat from the Equator (the Sun) breaking off and moving north (Summer) the patterns are so easily visible on a world scale. I think that’s why climate clowns show graphs/ raw data to hide the realization of where this heat starts and how it moves. Again IF it were CO2 the temps would be moving isothermally.
Naomi Seibt has a 157 IQ too bad Monckton got her.
“This same heat and light has a flux density of 1370 watts per square metre by the time it arrives at the upper atmosphere of the Earth. It is this energy that makes life possible on the surface of the Earth, that produces our terrestrial weather, and that photovoltaic cells can convert into electrical energy. Solar energy is, in actuality, nuclear energy!”
How did BAM allow this through the climate regime? Ooops!
[[Because the real problem is to calculate the average temperature over a long period of time, but the Earth is revolving, and the Sun bastes it like a rotisserie chicken while it cools, and that’s the real problem which they neatly skipped completely, i.e., they cheated ]]
Zonk! I stepped on my own you know what! I already cited Richard Feynman as having calculated the Earth’s avg. temperature using only the Earth’s gravity, average kinetic energy (caused by the Sun) and mass of the atmosphere along with the specific heat of its gases, and pressure profile. Even if you made a time-sliced simulation of the Sun-Earth climate system, the long-term avg. including the lapse rate should check with Feynman’s value. I wish I had the time to complete my astrophysics Ph.D. on it but I’m tied up with too many other projects and nobody would give me a job because the IPCC would blackball me 🙂
https://hockeyschtick.blogspot.com/2015/07/physicist-richard-feynman-proved.html
historyscoper,
It’s perfectly fine if the emperor has no clothes, because he cannot get sunburn on his privates with a sun at one-fourth power. The greenhouse sun, thus, is great for naked emperors.
And, on a separate note, if we add a substance having pH 4 with a substance having pH 7, we get a substance having pH11, right? Never mind the volume of the substance to which pH applies or the proper mathematical treatment of units of measure. 7 + 4 = 11, and that’s all there is to it.
Excuse me now, I have to run — got a turkey baking in my uniquely designed oven — it’s got five 70F elements circling the turkey, and the turkey has been in now for three hours, so, at 5 x 70F = 350F for three hours, it should be well done by now.
@Robert Kernodle
🤣👍
“I already cited Richard Feynman as having calculated the Earth’s avg. temperature using only the Earth’s gravity, average kinetic energy (caused by the Sun) and mass of the atmosphere along with the specific heat of its gases, and pressure profile”
historyscoper
Awesome.That is the ultimate source reference that I need.
Philip
From u/LackmustestTester on reddit. Says its the original energy budget. Comes from NASA.
Looks right to me, no mention of back radiation. No new energy being created from the atmosphere.
Yes that is MUCH more sensible…entirely sensible. I forget where that one originates…would be nice to have a source.
Gleaning from Joseph’s and Phillip’s work…
That energy budget would (at 944.53 W/m^2) put:
However for this “budget” to be really accurate it would have to be calculated for regional averages or cell averages. “Absorbed by Land and Oceans” would vary greatly from the tropical oceans to polar seawater in my humble opinion as well as land reflection/absorption, so you could get a logical cell to surface averages.
Clearly I am missing something.
Why I’m at it what really causes the reverse adiabatic effect at the Poles?
QUESTION about that energy-budget diagram:
Do the percentages actually represent energy? Or do the percentages represent flux that they are CALLING “energy”, you know, the way they call human-caused climate change just “climate change?
CDM,
You are looking at a dynamic atmospheric mass-motion process. The three atmospheric circulation cells (Hadley, Ferrel and Polar) are linked together in an interactive cog system. What goes up in the convection storms of the equatorial Doldrums (cooling the surface) comes down in the tropical deserts of the Horse Latitudes (delivering heat to the surface). What goes up in the cold cored cyclones of the temperate zone Ferrel cell (cooling the surface) comes down onto the ice deserts of the Poles (delivering heat to the surface).
I would think of it as percentages of total energy.
I kind of figured “isolating”the systems mentally was my first mistake.
Thank you Phillip,
Also fascinating in climate how energy in one system can be heat in another system (if that system is colder than the energy going in) or just energy decreasing temperature if more energy coming into the system is greater than the warmer energy already in the system.
<Longer wave radiation cannot increase the temperatures of shorter wave radiation.
One Nature’s cold can be another Nature’s heat depending on wavelength/frequency.
I love these papers sent to me of “proof”
https://www.livescience.com/hottest-arctic-circle-temperature-ever-siberia.html
Yet when Siberia hit coldest records ever in 2018 I believe, it was just weather.
@cd. i looked at the livescience article, and noticed that they didn’t, for some reason, say when the previous high temp occurred. then i found this: http://climaterealism.com/2020/06/temperature-hits-100-degrees-above-arctic-circle-just-like-100-years-ago/?fbclid=IwAR3-Jaan99FsP4fP58Rfo-Y1ZxQNlLUTNfpjsUnX5yCYQOR6qIb63fKfJRA
Lol that is beautiful, thank you 🙂 These people!
The media-pseudoscience complex must be destroyed.
CDM
The official definition of climate as a simple 30 year average of weather is disingenuous, that is how we measure climate, not what climate actually is. The original ancient Greek concept of climate referred to the slope of the face of the earth that is exposed to the rays of the sun. Aristotle identified just three climatic zones (Torrid, Temperate and Frigid), and our modern meteorological understanding of the location of the earth’s three atmospheric circulation cells (Hadley, Ferrel and Polar), leads naturally to a scientific definition of climate as the presence and action of a particular atmospheric circulation cell type within a given planetary latitudinal zone.
I’ve tried to narrow down a short interpretation of climate based largely on your comments and Joseph’s…
“The Sun supplies the energy that drives our climate and the climate is created from the ocean supplying massive thermal energy to the atmospheric cells: the Hadley, Ferrel and the Polar.”
I would like to expound it a little without getting too complicated and overwhelming to the average YT viewer.
Shouldn’t climate be measured in 60 year cycles to get an honest feedback of weather patterns and so forth?
I believe this was your comment?
“The natural climate cycle is 60 years. 30 years of zonal weather patterns associated with system warming, followed by 30 years of meridianal weather patterns associated with system cooling.”
“Shouldn’t climate be measured in 60 year cycles to get an honest feedback of weather patterns and so forth?”
CDM
Yes, 60 years captures both phases of the natural weather cycle. Using 30 years of zonal weather biases the values towards warming. It is worth noting also that current radiative based climate models assume zonal weather flow, and have not coped with the recent switch to the meridional weather patterns in the Ferrel cell that we are now experiencing.
(Note my corrected spelling error for meridional)
I was on that blog on WUWT blog by Roy Spencer, “Greenhouse effect: “How a cold atmosphere can warm the Earth’s surface””.
To be fair there is a sprinkle of posters who do not adhere to the back radiation explanation of the mythical greenhouse effect but they are loudly shouted down.
Most of the posters are lukewarmers but what is fascinating is the number of lukewarming hypotheses put forward on one blog and the ferocity of debate between the lukewarmers on whose hypothesis is “the correct one”. They don’t realise that they are just feeding climate alarmism by giving some credibility to the energy budget cartoon.
Warmist Alarmist: Most of the current warming is caused by unicorns.
Lukewarmer: Only a little of the current warming is caused by unicorns; most of it is natural.
Do you see the weakness in both arguments?
Exactly.
The source!
Paper: https://www.researchgate.net/publication/317228847_Progress_in_concentrated_solar_power_technology_with_parabolic_trough_collector_system_A_comprehensive_review
Garph from paper: https://www.researchgate.net/figure/Earths-energy-budget-from-NASA-29_fig15_317228847
source NASA: https://www.nasa.gov/images/content/57911main_Earth_Energy_Budget.jpg
Thank u/LackmustestTester
Wow good work!
Boomie are you part bloodhound? That’s crazy.
Joseph,
I’m about ready to crash I’m so tired but I read through what I could of this
https://agupubs.onlinelibrary.wiley.com/doi/full/10.1029/2009RG000282
I have never read such a collaboration of “intelligent sounding science” and then oops we’ll just slip in the climate science pig somehow, slap some lipstick on it and make it look pretty. This paper was the biggest blowhard misdirection I think I have read in a while it is a decade old so maybe they were hitting up for some huge funding.
“Nevertheless, IPCC [2007] concludes that changes in the Sun have played a role in the observed warming of the Earth since 1750, but these changes are very small compared to the role played by increasing long‐lived greenhouse gases in the atmosphere.”
See how they just make up BS? “GHGs” weren’t more prevalent until the 1960s, so how did they cause the majority of the warming which occurred since 1750.
God guys we live in some insane upside down backwards clown world.
So, I was looking at that “energy” budget diagram again, expressed as percentages, and I hate to tell you, but it looks like it’s just a sophistic switch of W/m^2 figures to percentages of the one-fourth-power sun at 340.4 W/m^2:
CO2 ALONE has done, in 60 years, what the sun could not do in 260 years.
Remarkable stuff, that CO2 !
Thank you Joseph your ability to reduce the fiction to just the facts are/is uncanny.
@Robert Kernodle

Use the 1370w/m^2 as the input. Then 70% of that is 960w/m^2.
I think it still checks out. At least it still agree’s with Postma’s model. or vice versa. They are not exclusionary. Derivative even.
Just get rid of energy flux density, and go total energy per unit time only. So forget about W/m^2, and put it in W, which is just Joules (energy) per second. That way the energy isn’t divided and diluted over the whole surface area.
So use 1370w/m^2 multiplied by the disk-area intercept to get the total energy per second. This other NASA graphic doesn’t do the backradiation thing and puts total energies where they should go.
Imagine that energy budget inside the little circle that says, “>90% zenith flux(to scale)”.
Right?
Very simply put. I think.
Well I between outer space and the surface
In between*
You what would be a fun exercise? For Joseph to list his basic thoughts of what he thinks a student with a basic college education in physics should know and by what year it should actually be known by.
Obviously basic thermodynamics should be a rule for any advanced physics courses or anything else involving climate science, astrophysics or geoscience. Well I’d hope chemistry teaches thermodynamics or that could cause some problems in the lab.
boomie789

Is this your annotation of Joe’s diagram or is it his original?
Please supply the original documented source for my reference.
Phillip,

I asked JP for an updated version he gave this link…
Thanks
Joe,
I suggest that you add Day and Night to the annotation of the two separate hemispheres of your diagram. (Or Daytime / Nighttime etc. YMMV).
The key point is that for the nighttime the energy is carried to this hemisphere both by the heated surface (planetary rotation) and also by by fluid motions (atmosphere and oceans).
More on this decade old paper presented to myself…
https://agupubs.onlinelibrary.wiley.com/doi/epdf/10.1029/2009RG000282
“Suggested mechanisms for solar influence on climate vary in their maturity: the most mature can be represented in climate models using well‐established physics, and their impacts on the modeled climate can be examined. The less mature are based on hypotheses that may be credible but have not yet been put into physical models in order to test their influence.”
6.4. Climate Change
“[164] Finally, the role of solar variability in climate change has received much public attention because reliable estimates of solar influence are needed to limit uncertainty in the importance of human activity as a potential explanation for global warming. Extensive climate model studies have
indicated that the models can only reproduce the late twentieth century warming when anthropogenic forcing is included, in addition to the solar and volcanic forcings
[IPCC, 2007].
The change in solar radiative forcing since 1750 was estimated in the IPCC [2007] report to be
0.12 W m−2, corresponding to an increase in TSI of 0.69 W m−2. A value of 0.24 W m−2 solar radiative forcing difference from Maunder Minimum to the present is currently considered to be more appropriate. Despite these uncertainties in solar radiative forcing, they are nevertheless
much smaller than the estimated radiative forcing due to anthropogenic changes, and the predicted SC‐related surface temperature change is small relative to anthropogenic changes.
[165] One thing that is very clear from this review is that enormous progress has been achieved in our knowledge and understanding over the past few decades. The topic has emerged from its beginnings of almost purely investigation of statistical relationships that were subject to substantial
criticism to become a solid scientific field that involves both solar physicists and climate scientists. Indeed, even 20 years ago it would have been very unlikely that the collection of scientific fields represented by the authors of this paper would have collaborated on such a review.”
What exactly is “solar forcing” suppose to imply?
@CD Marshall
My understanding is you don’t have to take physics to be a meteorologist/climatologist.
Which is why this scam has gone on so long.
They don’t want people who actually understand thermodynamics and physics.
They want to stay insulated so they can keep the scam going.
That’s why philosophy and rhetoric aren’t universally taught anymore either. The more people versed in truth seeking, the harder it is go run your scams.
Civics and economics too.
Economics would be a good mandatory class for climatologists/meteorologist.
Lol.
Seriously though it probably would. Good systems thinking skills.
Can we actually use the moon to determine what effect the atmosphere and ghgs have on the earth’s surface temperature?
The moon:
a) Same distance from the sun as the earth.
b) Orbital and rotational period, both around 27 days.
c) Hardly any atmosphere (not a good place to open a pub).
d) Day temperature can reach 127C.
e) Night temperature can dip to minus 173C.
f) Tiny amount of water.
Is the rotational period of the moon the big difference or is it the lack of an earth type atmosphere or a combination of both or something else?
I’m still stuck on the “energy-budget” diagram.
Energy means joules. To get joules, you have to determine the amount of energy received over a SPAN of time. What span would that be? Then you’d have to determine how much of that energy in that span clouds reflected — how the heck would you do that?
Each surface area or volume, seemingly, would have to be accounted for and worked out separately, ONLY in terms of joules — how the heck would you do that?
Then there’s the issue of the light side and dark side — how would you deal with that? — Seemingly you would have to use some averages over the whole sphere, which would get you right back at the one-quarter-power-sun issue.
I’m thinking that the idea of an “energy budget” itself is NOT tenable for a rotating sphere. There’s another, better way to handle this?
Robert,
The one-quarter-power-sun is an issue of quality not of quantity.
“Each surface area or volume, seemingly, would have to be accounted for and worked out separately, ONLY in terms of joules — how the heck would you do that?”
Well, Robert, Greta has already calculated this so why haven’t you? 🙂
I suppose that even if you could, what useful information would it offer?
I’ll take you back to June 2019.
“Culinary Arts Debunks Climate Change”
This was about the awareness that some averages are meaningless. The meaningless average I put forward was that the average person has one testicle but it was linked to the 4 weak suns argument for heating the planet. I’m sure it was you, Robert, who provided the pig on the spit cartoon.
I believe, if I can use the word “believe” on a website so focused as this one, that once you determine what is happening on one small area or volume and then go on to what is happening on another small area or volume and then go on to …..etc, etc, etc, then that’s all you have; data about what is happening in all the small areas and volumes on the planet.
What would you do then? I would stop there. Others would try and calculate some meaningless average.
Oh, I’ve just received notice of a prize for my telephone number being the average telephone number in my local telephone directory. I think I will keep schtum and accept it.
As I have said, regional is the only way to allocate energy and we are nowhere near that level of technology. Like geran has stated in the past, you would need direct surface to satellite back to surface confirmation. Some would be for energy in and out of the Earth’s system but also how that energy is used in the system.
Now imagine that 24 hours a day for each square meter of the planet in near real time and that’s ONLY to allocate the solar energy being dispensed in real time. Long and short term energy being in the system has to be allocated for. Oceans and depth have to be allocated for. Each portion of the atmosphere has to be allocated for in cubit meters/feet.
PLUS…
THE INFLUENCE OF…
Did I miss anything?
Jeesh and day and night, planetary rotation, and orbit you know the obvious ones.
We need Star Trek level of technology…
“Captain, I’m seeing a strange energy flux on the planet’s surface.”
“Energy flux?” Captain Picard rose from his chair. “Can you locate the energy signature, Mister Data?”
“Of course sir, it appears to be coming from…” Data turned to lock a puzzled gave upon Captain Picard. “An IPCC Climate Conference.”
“The IPCC this far into Federation Space?” Commander Riker leaned forward, “After the thrashing of the 2020 Postma Wars I thought we’d seen the last of them.” He turns to Warf, “red alert.”
“Delay that.” Picard raised a hand, “Let’s not jump to any conclusions just yet, Number One. Deanna can you reading anything?”
Deanna Troi hesitated, taken back by the oddly intense background music that began out of nowhere. “I sense nothing sir, as if they are devoid of any cognitive thought.”
“Mister Data, anything else from your scans?” Picard asked.
“Hot air sir, just hot air, “ Data replied.
“They’ll need that,” Riker said, “don’t those idiots know they are on an ice planet?”
“I sense warmth, they think the planet is burning up, their minds seem to be stuck in denial of reality” Deanna shook her head, as loud background music once again played.
“lay in a course for Risa, Data, I think we all need warmth after relaxation after this encounter.” Picard ordered.
“Aye, aye Captain, course laid in.”
“ENGAGE!”
Intense music plays in the background
“Seriously doesn’t anyone else hear that music?” Deanna pleaded. “Anyone?”
Very nice 🙂
“Deanna can you read anything?” Sorry I changed the phrase ans left the tense which then become wrong.
warmth and relaxation
Typos everywhere.
@CD Marshall
Lol.
Shame they don’t make Trek like that anymore.
You want to know why they stopped? The original company that owned the rites to Trek broke up after Enterprise was being made (which had more seasons slotted) the rights to Trek split up. One company had the rights to make new Trek shows/movies but were not allowed to use any original Trek cannon that the other company still held rights to.
The owner of those rights hated sci fi shows and refused to allow any more shows made, axed Enterprise in its prime.
The other company whoever they are now (Disney?) can make Trek shows w/o cannon which is why they had to rebuild the timelines.
Now something happened recently, not sure what, but the shows have been allowed to come back on, I think the president was canned which is why we got Discovery (a train wreck on cannon anything) and once again, Picard. I wish they’d reboot NextGen my absolute favorite version of Star Trek.
A current video on climate change propaganda…
Anyone up for trolling?
Canon not cannon, fodder excluded.
These are the people:
https://www.zerohedge.com/political/buzzfeed-reporter-who-got-zerohedge-banned-twitter-fired-plagiarism
Creeps. I am surprised it doesn’t come out more and equally surprised Twitter/YT/FB isn’t finding more excuses to ban people.
Roy Spencer says:-
““I find it incredible that someone with a degree in astrophysics does not understand that the time-averaged input over 24 hours on a rotating planet requires dividing a disk area by that of a sphere area.”
This is absolute incompetent nonsense . – The REALITY is their model has NOTHING to do with TIME AVERAGES at all.
Their divide by four rule applies no matter the period of rotation and as a Watt is a Joule per second their simplistic model has nothing to do with time or correctly accounts for the number of joules incident. Their model says the Moon’s surface absorbs the same number of Joules in its period of rotation of almost one month in Earth time as the Earth does in 24 hours and even the brain dead can see this is impossible – or maybe not !
I also wish people would stop banging on about Wien’s law and claiming the radiation emitted by a molecule of CO2 at blast furnace temperatures is really minus 80°C.
Just because you can apply Wien’s law in a totally incorrect manner does not mean the absurd claims are right. Yes the peak emissions at ~15 micron are comparable to emissions from an object at minus 80°C but so what ?
I’ve said it before and I’ll say it again – the Earth’s surface at 30°C is emitting a heap of radiation at 15 microns and CO2 can absorb a lot of this.
The peak emission value calculated by Wien’s law is irrelevant – There is loads of flux emitted by 30°C and most of this would be absorbed by CO2 and increase its temperature which by conduction and convection can increase the atmosphere’s temperature but its effect is ~0.06% due to the mass ratios.
The absorption bandwidths for CO2 are clearly shown. CO2 does have an impact on incoming solar radiation distinct from the bandwiths of water vapour.
At 4.3 micron there is little emissions from the Earth’s surfaces at ambient temperatures but there are watts available from Sunlight.
The whole of the CO2 bandwidth centred at ~15 micron is capable of absorbing significant emissions from a 30°C surface independent of water vapour – but it remains a trace gas of very low mass ratio.
As for the “bottle” greenhouse experiments they do NOT show a “greenhouse effect” at all !
They merely demonstrate well known physical properties – CO 2 is a better insulating gas than ordinary air.
As the thermometers are directly irradiated by the radiation from the light source they are not indicating the gas temperatures.
To paraphrase Spencer temperature depends on energy in minus energy out.
Hence the high intensity radiation from the lights heats the thermometers directly and the temperature indicated depends on how much energy each loses by all means.
As CO2 is a better insulator logic says the thermometer in that jar will record a higher temperature under identical input – it cannot “shed” the same amount of energy as quickly as the ordinary air because CO2 is a better insulator – just check out the properties of both at Engineering Toolbox.
CO2 has a lower Specific heat than air and about half the thermal conductivity – all values include any radiation effect.
For goodness sake stop talking about the peak emission temperatures – it is meaningless !
ROSCO,
At 3k meters nothing from the surface is emitting in the 30C range, at 1500 meters only small pockets of air from the Equator are reaching 30C. Even at 500 meters in near real time the only pockets reaching 30C or up is small parts of Africa and China (currently), even at that altitude the average temps are around 20C at the Equator. I’m not seeing plenty of emissions at 30C other than the Equator and that is still in the optimum range of water vapor especially at the Equator.
I don’t see CO2 doing much for the surface but doing a lot to exchange energy from hotter molecules and helping the atmosphere to cool off faster. The peak emissions is still between 9-10 microns and the open window of IR even at 303 Kelvin, so what is being ejected into space is immediately cooling the atmosphere off more.
CO2 in a relaxed state is not IR active, so however it gets heated into IR active mode (molecule contact energy transfer or Raman Scattering) these are the basic states of vibrational modes and the requirements according to the works of KK which seem pretty impressive to myself and my 3 months(?) of particle physics education.
So 15 microns is simply its peak bend mode?
So lets just hypothetically say 33% of IR is reflected back to the surface from CO2, how much of that is even going to be higher energy photons? Even if say ALL were at the exact peak emissions of the radiative surface below it, it could at best help maintain that temperature a little longer than normal.
Agree or disagree? That is the question.
“At 3k meters nothing from the surface is emitting in the 30C range”
CDM
I agree. Have a look at my analysis of the CERES image here:
https://www.researchgate.net/publication/334480358_Calibrating_the_CERES_Image_of_the_Earth%27s_Radiant_Emission_to_Space
This shows that for the tropical Hadley Cell the ground surface has to be at an elevation of greater than 3,160m before there is any direct emission of surface thermal radiation out to space.
For the Ferrel Cell the surface elevation has to be greater than 1,510m while for the Polar Cell the figure is 310m. What this means is that for the majority of Antarctica, the ice surface will radiate directly out to space unimpeded by atmospheric opacity.
Thanks Philip,
DL it to read
“ROSCO,
At 3k meters nothing from the surface is emitting in the 30C range, at 1500 meters only small pockets of air from the Equator are reaching 30C.”
What the ??
You have become as adept as all of the fake greenhouse effect defender sceptics at constructing strawmen.
If you read what I actually wrote your statement is totally irrelevant !
Just what do you mean by “At 3k meters nothing from the surface is emitting in the 30C range” ?
If you mean the ambient air temperature at 3k metres is not 30°C well I think everyone knows that.
However your point is irrelevant – “Turning our attention to the example of Langley’s greenhouse experiment on Pike’s Peak in Colorado (mentioned by Arrhenius, 1906b), we may be tempted to ask how it is that a greenhouse can reach such high temperatures. Qualitatively, we may attribute the difference between the 15ºC mean surface temperature and the 113ºC observed in Langley’s greenhouse….”
113 °C at 4,302 m. – Don’t try to tell me the solar radiation that induced that temperature is not capable of heating the exposed land surfaces to 30°C – I NEVER MENTIONED AIR TEMPERATURES
But if you mean that at 3k metres it is not possible to detect emissions from the Earth’s surfaces that indicate the SURFACE temperature is ~30°C then again you are completely wrong.
“I’m not seeing plenty of emissions at 30C other than the Equator and that is still in the optimum range of water vapor especially at the Equator.” – ABSOLUTE NONSENSE or TOTALLY IRRELEVANT !!
Clearly at 950 kilometres above the Earth’s surface radiation emitted from Earth indicates a clear temperature of over 290 K up to ~300 K between the wavelengths of 8 to ~13 micron.
Like much of what passes for supposed discussion these days actual facts do not matter and the actual facts show your discussion is ? – well frankly I don’t know what you are talking about.
Just what is your point ?
I guess CO2 doesn’t exist in the greatest concentration at ground level where it absorbs heat from contact with, and radiation from the surface ?
I really don’t care about the radiation for CO2 at all – I was simply trying to show how meaningless the peak emissions from Wien’s law are.
Hell the peak depends on the variable chosen and is not a constant – compare the Nimbus chart to the wavelength plot I plotted.
One says peak emissions occur at ~9.6 micron while he other says between 17 and 18 micron and both are right !
Anyone who claims that the radiation from blast furnace CO2 – a subject studied at length – has a Planck radiation temperature of minus 80°C is talking absolute rubbish !
The alarmists are the ones saying the peak admissions of CO2 is at 15 microns. Again, for CO2 to emit at a higher wavelength/frequency it would need to be “spun up” to absorb and heat at that level, doesn’t it? Can it go from a relaxed state to V3 on its own or does it need to have higher energy transferred to it first?
My point about temps is pretty relevant, only at the Equator (mainly) are temps high enough to emit around 30C, so surface close to Earth and back to surface is the bulk of IR re-radiation at higher temperatures below the TOA.
Over the TOA would have “blast furnace” heat and CO2 works differently at that level doesn’t it? Only radiating mostly in one direction?
Energy is just energy and photons only carry energy equal to their WL/F and 15 microns carries the energy of 0.0827 eV. If our entire planet somehow was overwhelmed with just 15 microns and that energy surpassed the input of the Sun we’d be in an ice age.
My point is where is the higher energy coming from which makes me suspicious of that chart. They claim both incoming and outgoing is being shown there at the TOA but how when just below that is freezing cold. Is that chart accurate of the entire Earth’s emissions or did they just pick the hottest record they could find and claim that is the entire planet all the time?
Something on that chart is not adding up, well besides my sciences skills, naturally. I’m not arguing with you Rosco, I value your input as I do others.
The chart show is from a well respected textbook on atmospheric radiation by Petty.
Yes it is above the tropical Pacific Ocean at noon. If it had been above the Sahara the energy emissions would have been much higher and if it had been above the Arctic the energy emissions would have been much lower.
Here is a thermal image of a desert – regarded as the highest surface temperature measured on Earth – 70.7°C – 30° 36′ 18.00″ N – not even in the tropics.
Imagine the emissions plot for that.
Looking at the Planck curve I plotted it is easy to see there is a large amount of energy emitted by a 303 K object at 15 microns.
15 Micron energy emissions from 30°C do not have a temperature of minus 80°C.
“The alarmists are the ones saying the peak admissions of CO2 is at 15 microns.”
No – everyone who understands Planck’s law agrees with that IF, and only IF, one plots the data for approximately 300 K in a Planck curve the peak coincides with 15 microns and that is the centre of the CO2 ABSORPTION waveband in WAVENUMBER format !
Switch to WAVELENGTH format and Wien’s peak for emissions for approximately 300 K becomes ~9.6 microns and this value is right in the atmospheric window.
This proves what I was trying to get geran to see but he was too conceited to acknowledge he was plainly wrong and didn’t understand – the Wien’s peak emissions for a given temperature is different for Wavenumber plots(which geran did not understand are NOT frequency as defined – a standing wave can have wavenumber and wavelength but no frequency as defined in science) than it is for wavelength plots.
The difference does not mean the coincidence with CO2 absorption – NOT emission – at 15 micron means anything at all.
Stop thinking in terms of this nonsense – both graphs are mathematically correct and the nonsense claimed by the articles on PSI by Geraint Hughes and supported by geran that these graphs are fake in infantile ill-educated bullshit based on a complete misapplication of the laws of blackbody radiation.
I’ve said this so many times – the argument that Wien’s displacement law proves anything at all when comparing different variables is stupid.
Both are exactly correct in their mathematical context.
Yes alarmists talk bullshit about the significance of a wavenumber plot and peak emission at ~15 micron+ meaning anything at all but the counter argument that the wavenumber plot is fake is absurd beyond belief !
ROSCO,
100 kilometers above the Earth is the “top of the atmosphere.” This is where incoming and outgoing radiation meet. I’m guessing you meant 95 km just below that line? However, doesn’t that line fluctuate from day to night?
Truth is always the enemy of power. Exposure of power’s motivations, depredations, and corruption never serves power’s ends. Truth is often suppressed and those who disclose it persecuted. Any illegitimate government (currently, all of them) that fails to do so risks its own termination.
What if, instead of suppressing the truth, a regime could render it irrelevant and not have to worry about it? That prospect is the Holy Grail for those who rule or seek to rule.
Robert Gore, “Make the Truth Irrelevant,” Straight Line Logic, October 16, 2019
Facts don’t matter. Plan accordingly.
Facts mean nothing to true believers and they will not be swayed.
Re “Christopher Moncton”
It’s spelled “Christopher Monckton”
Hi Phillip,
I was wondering that little hot strip that runs through Northern Africa and the Arabian Peninsula, does it have a reference or a name in meteorology or geology?
I’ve read some studies where it is believed South Africa to be connected to magnetic decay and has occurred at that spot for millennia associated with severe droughts and heat.
https://agupubs.onlinelibrary.wiley.com/doi/full/10.1002/2017GL076007
But I have not come across anything for Northern Africa but it does seem like Africa takes the hit on these geological anomalies. As always thanks for your input. If you had a Geology Blog I’d read it.
CDM
That’s an interesting link.
I need to think about it.
Thanks